Contents8 sections
- What a cross-asset selloff is: when correlations jump toward one
- Deleveraging and margin calls: how forced selling spreads
- The dollar and the dash for cash: why gold and Treasuries get sold
- March 2020 in numbers
- Indicators to check when everything is falling
- Did diversification fail? Limits of asset correlation and how to prepare
- Frequently asked questions
- Sources and references
A cross-asset selloff, the kind of day when it feels like everything is crashing together, rarely means that stocks, crypto and gold all lost their value at once. More often it means that a large group of investors needed cash immediately and sold whatever they could sell quickly. Leveraged traders facing margin calls dump winners as well as losers, including liquid assets such as gold and government bonds, and that selling pushes prices down far enough to trigger the next round of margin calls. This guide, written in November 2026 from primary sources published by central banks, the IMF and the World Gold Council, explains that chain reaction and the indicators you can check yourself. It does not claim to know the cause of any particular day's drop.
What a cross-asset selloff is: when correlations jump toward one
In normal markets, assets don't move in lockstep. When stocks slide, gold or Treasuries often rise and cushion a portfolio, which is the whole point of diversification. Under extreme stress that pattern can break down for days or weeks, and assets that usually move independently start falling on the same sessions. Traders describe this as correlations 'going to one.'
The World Gold Council noted in March 2020 that gold's correlation with stocks generally turns negative as stock prices tumble, but that there seems to be an exception during disorderly selling when volatility spikes to extreme levels. It pointed to 2008-2009, when gold came under pressure as the VIX hit record highs (World Gold Council). A simultaneous drop is less a verdict on gold as a safe haven than a symptom of a liquidity squeeze.
Crypto has joined the club. An IMF note found that volatility spillovers from bitcoin to the S&P 500 and MSCI emerging markets indexes rose by about 12-16 percentage points after the pandemic began, and return spillovers by about 8-10 points. In absolute terms bitcoin explained roughly 14-18% of the variation in equity volatility (IMF). When risk appetite fades, crypto and equities can trade as one risk bucket.
Deleveraging and margin calls: how forced selling spreads
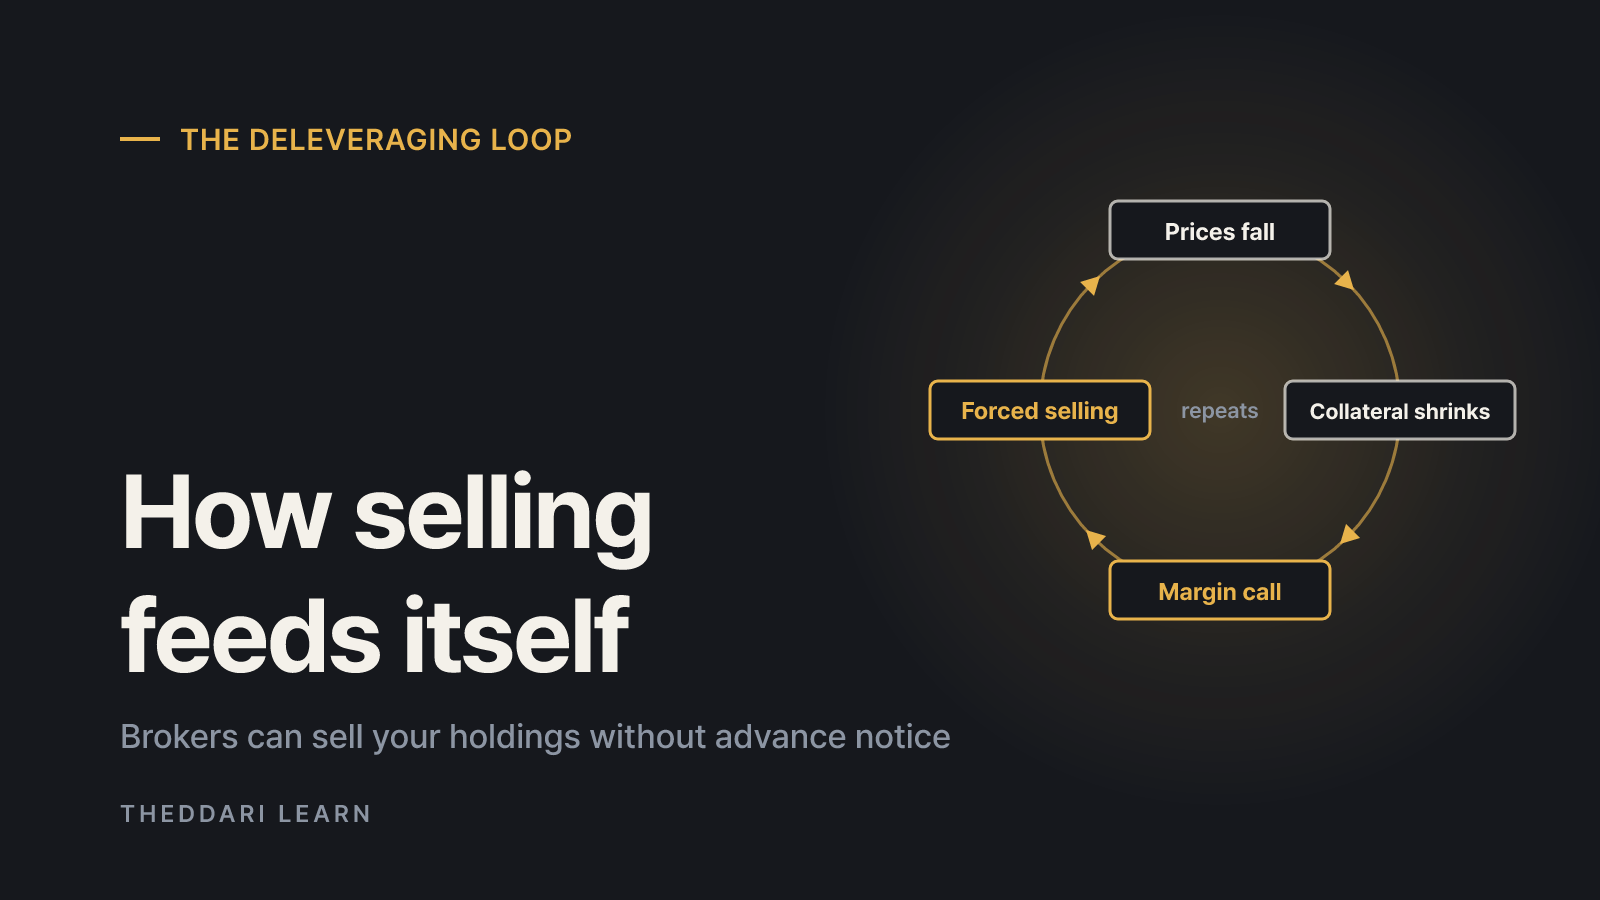
Deleveraging means shrinking positions that were built with borrowed money. Sometimes it is voluntary; in a crash it is often forced. The SEC's Investor.gov explains that if securities bought on margin decline, a brokerage firm can demand more cash or securities immediately, or sell securities in your account without informing you in advance, and the firm decides which ones to sell. Even if you are told you have a few days, the broker may still sell before then, and it can change the margin threshold at any time (Investor.gov).
- Falling prices reduce the value of collateral.
- Margin calls hit, and exchanges or brokers may raise margin requirements at the same moment.
- Investors and intermediaries raise cash by selling their most liquid holdings first: large-cap stocks, gold, Treasuries, bitcoin.
- That selling drags down other assets and creates margin shortfalls in other accounts.
- As volatility climbs, market makers pull back their quotes, so each sell order moves prices further.
The Bank for International Settlements found that for about two weeks in mid-March 2020, government bond markets sold off sharply in risk-off episodes when they would normally attract safe-haven buying. Evidence in the US Treasury market pointed to forced selling by investors who had used leverage to exploit small yield differences (BIS). Even the safest asset can be dumped if leveraged players hold enough of it.
Crypto markets can run through this chain even faster. Perpetual futures trade around the clock, and exchanges liquidate under-margined positions automatically. Cascading liquidations can spill into spot prices, and in extreme cases an exchange may use auto-deleveraging (ADL) to cut profitable positions on the other side. theddari's ADL page explains how exchanges handle these automatic reductions.

The dollar and the dash for cash: why gold and Treasuries get sold
A stronger US dollar often shows up alongside a cross-market crash. Banks, funds and companies around the world borrow in dollars and post margin in dollars, so stress creates a rush to secure them. Minutes from the Federal Reserve's March 15, 2020 FOMC meeting recorded that, since the late-January meeting, the S&P 500 had fallen 18 percent and crude oil 40 percent, while the dollar appreciated notably against most currencies, with the exception of other safe-haven currencies (Federal Reserve).
Gold's slide fits the same cash story. The World Gold Council said gold was likely used to cover losses elsewhere because it is a high-quality, highly liquid asset, trading more than US$260 billion a day in March 2020, and because it was up about 10% for the year as of March 9, ahead of other major assets. It also noted that net long positioning in COMEX gold futures had been very high before the pullback, and that some leveraged holders may have been forced to sell to meet margin requirements (World Gold Council).
Gold is usually quoted in US dollars. When the dollar rallies, the dollar price of gold is pressured, but gold priced in pounds, euros or other currencies may fall less or even rise. If you invest from outside the US, check your returns in your home currency.
March 2020 in numbers
The table below uses World Gold Council figures for year-to-date returns as of March 18, 2020, measured in each investor's local currency. Stocks fell hard everywhere, but gold's result depended on the currency: slightly negative for US and Japanese investors, positive for UK and euro-area investors.
US (S&P 500)
- Stock index YTD
- -25.6%
- Gold in local currency YTD
- -1.1%
Japan (Nikkei 225)
- Stock index YTD
- -29.3%
- Gold in local currency YTD
- -1.5%
Europe (Euro Stoxx 50)
- Stock index YTD
- -36.4%
- Gold in local currency YTD
- +2.2%
UK (FTSE 100)
- Stock index YTD
- -33.0%
- Gold in local currency YTD
- +11.5%
The same report noted that the 10-year Treasury yield had climbed back above 1% after hitting a record low of 0.33% on March 9. Rising yields mean falling bond prices, so long-dated Treasuries were being sold even after the Fed's emergency rate cut on March 15. The Council added that gold also fell 15-25% in dollar terms a couple of times during 2008, yet ended that year as one of the few assets, alongside Treasuries, with a positive return. That history is context, not a promise that the next crisis will follow the same path.
Indicators to check when everything is falling
Headlines tend to pick one villain. Layering a few indicators helps you tell an earnings or growth scare apart from a cash-raising, deleveraging selloff. Either way, revisit your reading once official data come in.
- 1
Are the usual hedges falling too?
If gold, long-dated Treasuries and bitcoin drop on the same day as stocks, broad cash demand is a plausible driver. If gold and Treasuries rally, you are looking at a more classic flight to safety.
- 2
Check the dollar index and your home currency
See whether the dollar is rising against nearly every currency at once. Compare it with the yen and Swiss franc; their behavior helps separate dollar funding stress from simple rate differentials.
- 3
Watch volatility and credit spreads
A spike in the VIX and widening gaps between corporate and government bond yields signal that intermediaries are taking less risk. Expect thinner order books and bigger price gaps.
- 4
Look at crypto liquidations and funding rates
A sudden drop in futures open interest, heavy liquidations, or funding rates flipping from positive to sharply negative suggest leverage is being forcibly unwound.
- 5
Line up the calendar
Jobs reports, inflation prints and central bank meetings can concentrate position cutting. Use the schedule to narrow down candidate causes, not to forecast direction.
You can compare crypto funding rates across exchanges on theddari's funding rate page and see upcoming macro releases on the economic calendar. Both are tools for checking conditions; cross-check key dates and numbers with the official publisher.
Did diversification fail? Limits of asset correlation and how to prepare
After a day when everything crashes together, it is tempting to conclude that diversification is a myth. A better lesson is that asset correlation is not a constant. It shifts with market conditions, and sizing positions on calm-period correlations alone can understate losses in a stress window. Don't assume that a correlation measured over the past few years will hold in the next panic.
- Leverage is the biggest difference. An account with no borrowed money can't be forcibly liquidated, so you keep the option to wait for a recovery.
- Keep spending money separate. An emergency fund outside your investment account reduces the chance you sell at the worst moment.
- Know your currency exposure. Gold and foreign stocks can produce very different results once converted into your home currency.
- Stress-test your mix. Ask whether you could hold through a period like March 2020, when major stock indexes were down roughly 25-36% for the year.
- Treat crypto as a risk asset. Given the stronger links the IMF documented, don't count on bitcoin as a reliable hedge for equities.
When stocks, crypto and gold drop together, start by asking who needs cash and why. Margin calls, dollar funding pressure and fund redemptions can push short-term prices down regardless of long-term value. Knowing whether your own account uses leverage, where its liquidation thresholds sit and how your returns look in your home currency lets you respond to numbers rather than to the fear in the headlines.