Contents8 sections
- What counts as a stock market crash or bear market?
- Bear market recovery time: a two-year median with a long tail
- What to do in a market crash: why panic selling is expensive
- Five rules to set before the next crash
- What to avoid during a crash, and the exceptions
- Bottom line: crashes are a preparation problem
- Frequently asked questions
- Sources and references
When a stock market crash hits, the most useful first step is not guessing the bottom. It is checking when you will need the money and whether your cash reserve can carry you without selling at low prices. As of October 2026, the public data reviewed here shows that the median S&P 500 bear market since 1950 took about two years to get back to its previous peak, but three of them took more than five years. This guide explains how to read those recovery numbers and which rules to set in advance. It does not predict the timing or depth of any future decline.
What counts as a stock market crash or bear market?
Crash is a headline word, not a formal definition. Market convention calls a closing decline of 10% to 19.9% from a recent high a correction and a decline of 20% or more a bear market. A new bull market is usually dated from a 20% gain off the low. According to Hartford Funds, which uses Ned Davis Research data, the S&P 500 has had 27 bear markets since 1928, with an average loss of about 35% and an average peak-to-trough length of 289 days, or roughly 9.6 months.
Counts vary with method. Hartford's list splits choppy periods such as the early 1930s or 2000 to 2002 into several bear markets. Counting only 20% declines from an all-time closing high, there were 11 bear markets after 1950. Most statistics also use the price index, which ignores dividends and inflation. When you compare figures from different sources, check the definition, the period and whether the series is price-only or total return.
A bear market is not the same as a recession. Hartford Funds counts 27 bear markets since 1928 but only 15 recessions over the same span. Bear markets that overlapped with recessions have generally been the deeper and longer ones.
Bear market recovery time: a two-year median with a long tail
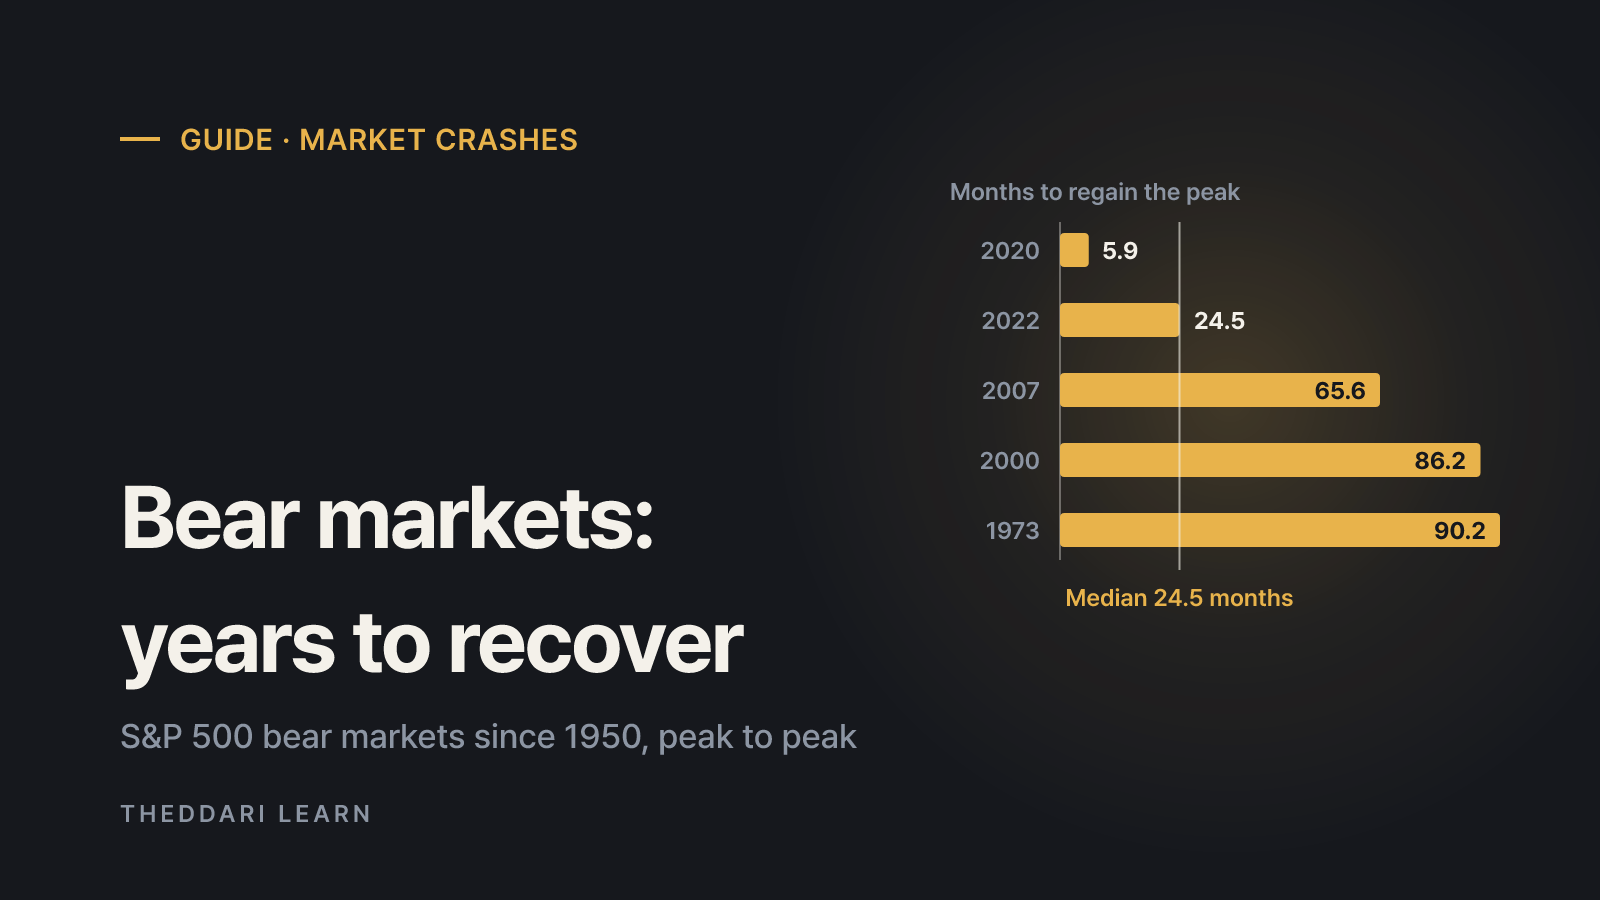
Using S&P 500 daily closes from January 1950 to September 2026, AssetWhisper's analysis finds 11 bear markets with a median depth of 33.5%, a median 14.6 months from peak to trough and another 15.2 months from trough back to the old high. Peak to peak, the median was 24.5 months. The mean was 38.1 months because the distribution is skewed: eight episodes recovered within 40 months, while the other three took 65.6, 86.2 and 90.2 months. A plan built on the median quietly assumes the worst cases away.
Jan 1973
- Decline
- -48.2%
- Months to trough
- 20.7
- Trough to old high
- 69.5
- Peak to peak
- 90.2
Nov 1980
- Decline
- -27.1%
- Months to trough
- 20.4
- Trough to old high
- 2.7
- Peak to peak
- 23.2
Aug 1987
- Decline
- -33.5%
- Months to trough
- 3.3
- Trough to old high
- 19.7
- Peak to peak
- 23.0
Mar 2000
- Decline
- -49.1%
- Months to trough
- 30.5
- Trough to old high
- 55.7
- Peak to peak
- 86.2
Oct 2007
- Decline
- -56.8%
- Months to trough
- 17.0
- Trough to old high
- 48.6
- Peak to peak
- 65.6
Feb 2020
- Decline
- -33.9%
- Months to trough
- 1.1
- Trough to old high
- 4.9
- Peak to peak
- 5.9
Jan 2022
- Decline
- -25.4%
- Months to trough
- 9.3
- Trough to old high
- 15.2
- Peak to peak
- 24.5
The rows above are selected from that dataset and are price-only. The 2020 COVID crash fell 33.9% in about a month and regained its high less than five months after the low, an unusually fast case. The 1987 episode, which included Black Monday, bottomed in just over three months yet needed almost 20 more to recover. Speed of the fall says little about speed of the recovery.
Dividends shorten the wait; inflation lengthens it
The same analysis recalculated the record using total return after inflation. On that basis, the August 2000 peak was not regained until May 2013, so the dot-com bust and the 2008 financial crisis become one drawdown lasting about 12.8 years rather than two separate bear markets. Reinvested dividends work in the other direction and shorten the time underwater. Decide whether you care about the nominal account balance or the purchasing power of the money before you rely on any recovery figure.
Why deeper losses take disproportionately longer
Part of the pattern is arithmetic. If an investment falls by a fraction d, the gain needed to break even is d / (1 - d).
| Decline | Gain needed to break even |
|---|---|
| -10% | +11.1% |
| -20% | +25.0% |
| -33.9% (2020) | +51.3% |
| -50% | +100.0% |
| -56.8% (2007-2009) | +131.5% |
The same math explains why leverage and concentration are dangerous in a crash. A leveraged fund or a portfolio built on one or two stocks can fall much further than the index, and the gain needed to recover grows quickly with every extra point of loss.
What to do in a market crash: why panic selling is expensive
The most common mistake is selling during the fall with the intention of buying back once things feel calmer. By then, much of the rebound has often already happened. In AssetWhisper's data, the 12 months after each of the 11 lows since 1950 were positive, with a median gain of 33.7%. Hartford Funds notes that about 42% of the S&P 500's strongest days in the last 20 years occurred during bear markets and another 36% in the first two months of a new bull market. The best and worst days cluster together, which makes stepping aside for one without missing the other very hard.
Schwab's March 2026 analysis shows the cost. From 2006 to 2025 the S&P 500 returned 11% a year; missing only the 10 best days cut that to 6.6%, and missing the 30 best days cut it to 1.6%. The same study found an average intra-year maximum drawdown of about 15% between 1975 and 2025, with declines of 20% or more in 14 of those 50 years. Sizable drops are a normal feature of owning stocks, not a sign that something unprecedented is underway.
Past bear markets do not set the depth or length of the next one. These figures describe one US large-cap index. Other countries, sector funds and individual stocks have produced much worse records.
Five rules to set before the next crash
Good crash behavior is mostly decided before the crash. The checklist below is not a recommendation to buy or sell any product. It is a way to make decisions from rules rather than headlines.
- 1
Match money to its time horizon
Money needed within one to three years, such as a house deposit, tuition or living costs, should not depend on a stock recovery. Schwab notes that investors with horizons longer than two to three years risk cutting into future returns if they miss the rebound, which also means shorter-term money has no time to wait.
- 2
Hold enough cash to avoid forced selling
Schwab recommends keeping sufficient cash reserves so that a job loss or medical bill does not force you to sell stocks at depressed prices. If you use margin, review the loan size before volatility rises, because a margin call can liquidate positions at the worst moment.
- 3
Diversify across asset classes
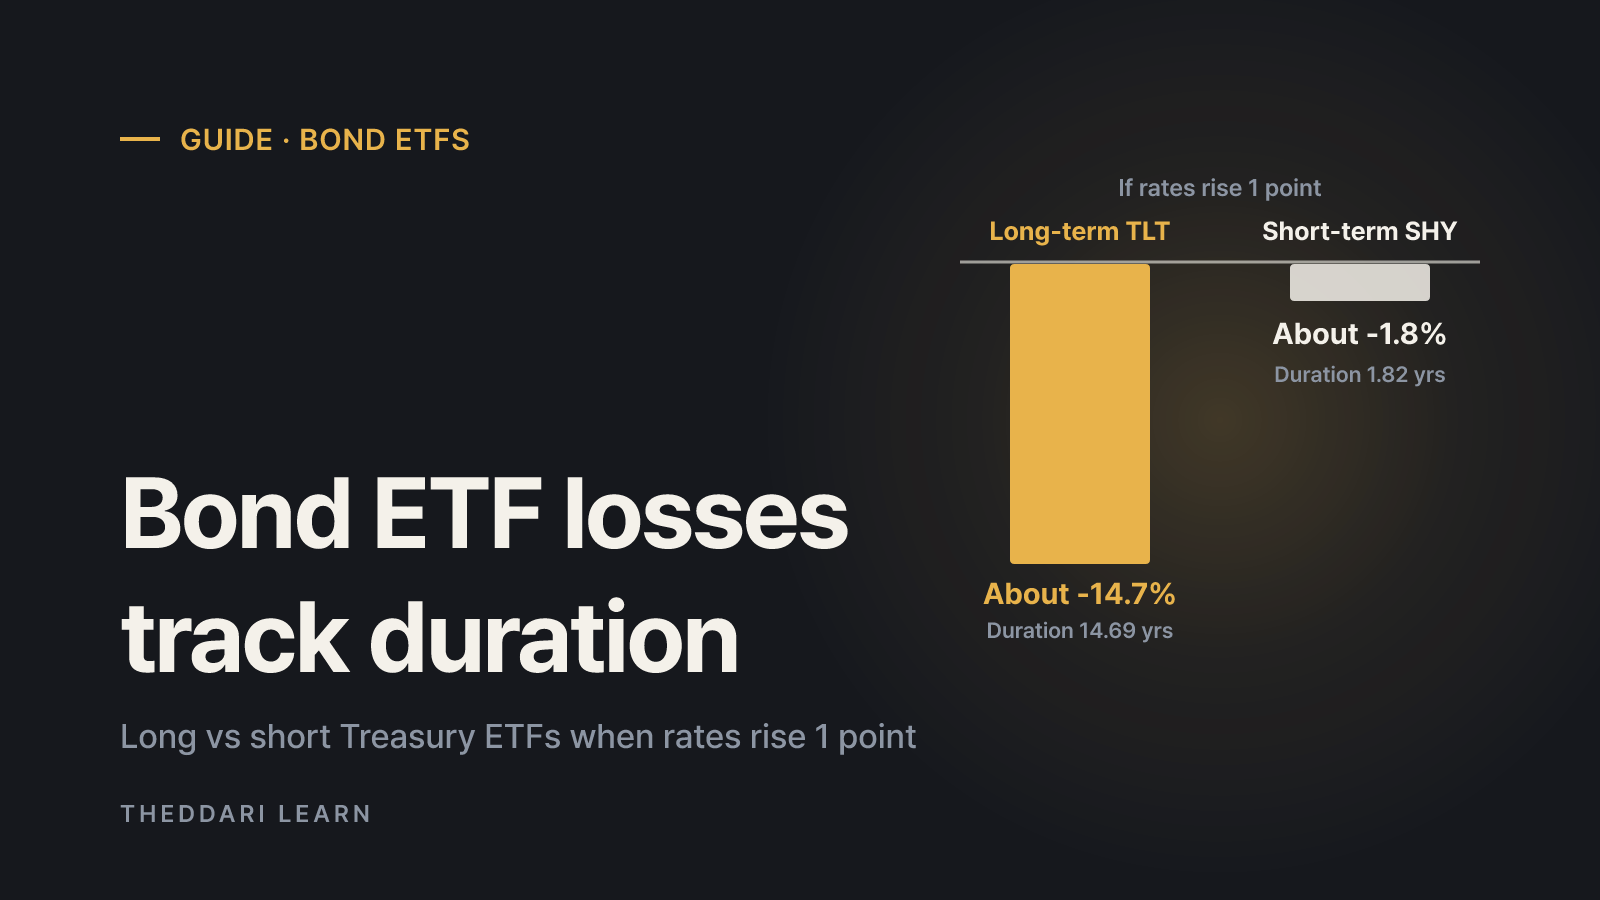
Investor.gov explains that stocks, bonds and cash have historically not moved up and down at the same time, so combining them can limit large losses. In Schwab's figures, the S&P 500 fell 51% in 2007-2009 while a 60% stock and 40% bond portfolio fell 31%. Bonds can still lose value when interest rates rise.
- 4
Write a rebalancing rule in advance
Pick a target mix, for example 60% stocks, and rebalance on a schedule such as every six or twelve months or only when weights drift past a set band. Investor.gov describes selling overweight assets, buying underweight ones, or directing new contributions to the lagging category, and reminds investors to consider fees and taxes first.
- 5
Swap headlines for schedules and your own account
During a crash, alarming headlines multiply. Narrow your inputs to scheduled economic releases, company earnings dates and how far your own allocation has drifted from its target.
The theddari economic and earnings calendars gather those dates in one place. They help you know what is scheduled, not which way prices will move afterward.

What to avoid during a crash, and the exceptions
- Doubling down with leverage: borrowing or buying leveraged products to recover faster raises the gain needed if prices keep falling.
- Concentrated bargain hunting: index recovery data does not apply to a single stock. Check earnings and balance sheets before assuming a cheap price is a bargain.
- Panic orders around halts: US market-wide circuit breakers pause trading for 15 minutes after a 7% or 13% S&P 500 drop before 3:25 p.m. Eastern and close the market for the day after a 20% drop, according to Investor.gov. A halt is not a bottom signal.
- Selling with no re-entry rule: without a written plan for getting back in, a temporary paper loss easily becomes a permanent one.
There are legitimate exceptions. If you are close to retirement or need a large sum soon, reducing risk can be exactly what your plan calls for. Investor.gov notes that the most common reason to change an asset allocation is a change in time horizon, and that savvy investors rebalance rather than shifting allocation because one asset class is hot or cold. The point is to adjust because your situation changed, not because the market scared you. For a broader read on market chatter, theddari's stock Telegram trend page collects channel discussion, but treat rumors as leads to verify against official filings.
Bottom line: crashes are a preparation problem
History shows that S&P 500 bear markets arrive more often than most people expect, that most have recovered within a few years, and that a few have taken more than five. Capital Group found that after each of the 18 largest declines since the Great Depression, the index was higher five years later, yet that is still the record of a single US index. Separate short-term money, keep a cash reserve, diversify and write down your rebalancing rule. Then, when the next crash arrives, you will have far fewer decisions to make under pressure. Date your checklist and revisit it when your circumstances change, not when the headlines do.