Contents7 sections
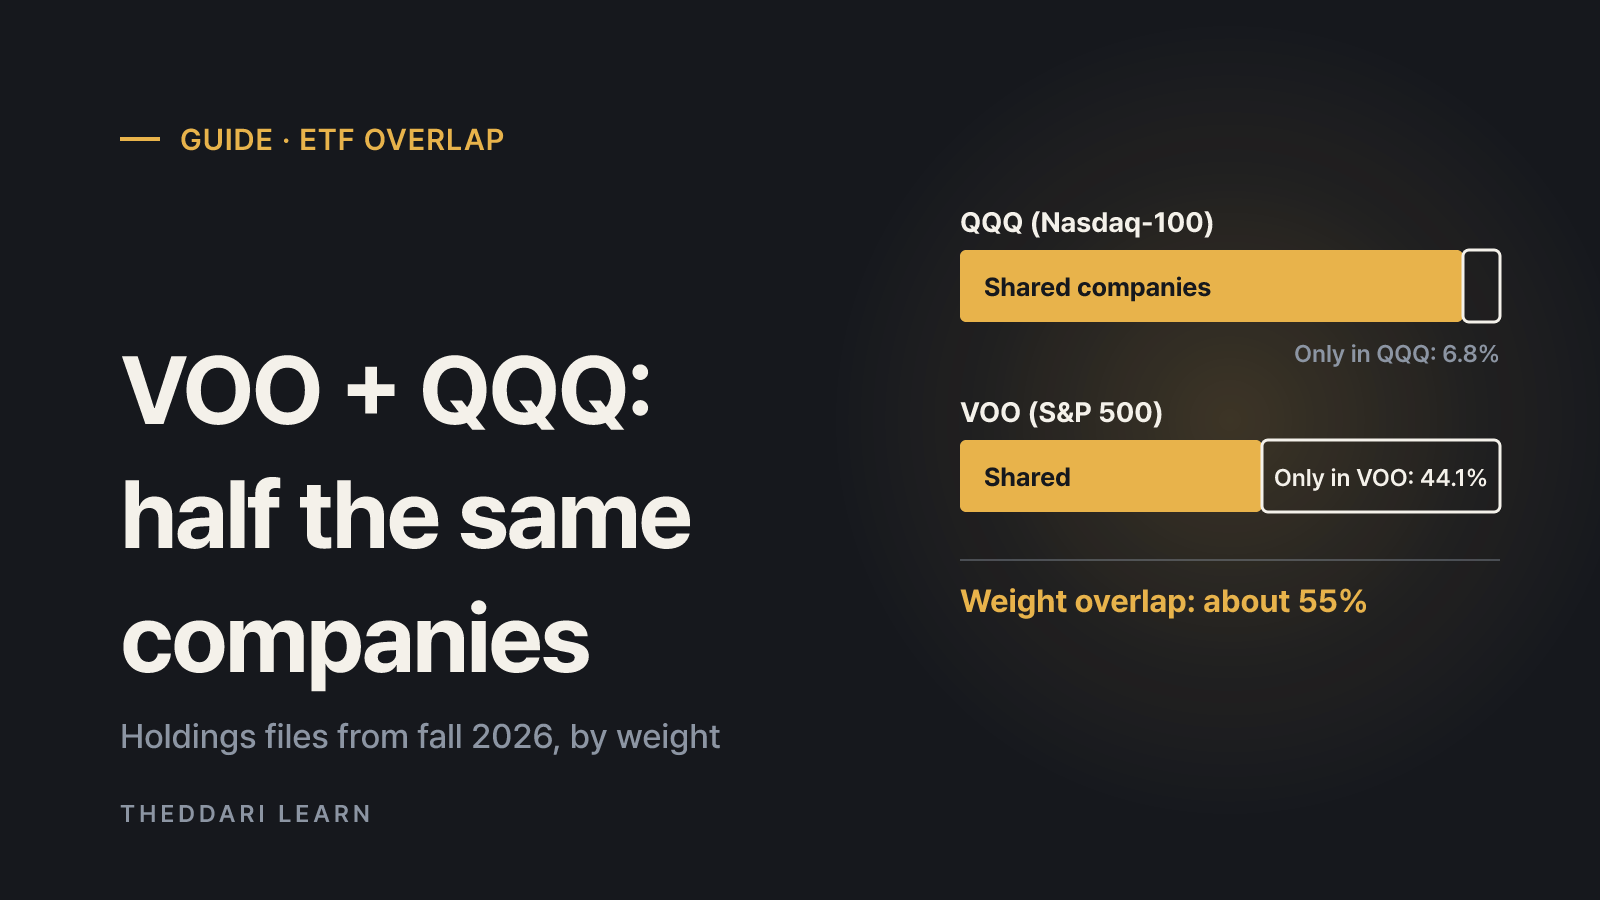
The S&P 500 Nasdaq 100 overlap is large: based on issuer holdings files published in fall 2026, the Vanguard S&P 500 ETF (VOO) and the Invesco QQQ Trust (QQQ) share about 55% of their portfolios by weight (Overlap Monitor, using QQQ holdings as of October 29, 2026 and VOO holdings as of September 30, 2026). That does not make owning both pointless, but it changes what the second fund does for you. Instead of adding hundreds of new companies, QQQ mainly increases your weight in technology and a handful of mega-caps. This guide explains how overlap is calculated, how to read the numbers, and how to check what your own combination actually holds.
How big is the S&P 500 Nasdaq 100 overlap?
The two indexes are built differently. The S&P 500 covers roughly 500 large US companies weighted by market value. The Nasdaq-100 holds about 100 of the largest non-financial companies listed on the Nasdaq Stock Market. Nasdaq's own index page lists the exclusion of financials, market-cap weighting, quarterly rebalancing and the inclusion of some international companies as defining features. So most Nasdaq-100 members also appear in the S&P 500, while the S&P 500 contains many banks, insurers, energy producers and health care firms that the Nasdaq-100 never holds.
Positions held
- QQQ (Nasdaq-100)
- 102
- VOO (S&P 500)
- 504
Shared positions
- QQQ (Nasdaq-100)
- 87
- VOO (S&P 500)
- 87
Not in the other fund
- QQQ (Nasdaq-100)
- 15 positions, 6.8% of weight
- VOO (S&P 500)
- 417 positions, 44.1% of weight
Top 10 holdings
- QQQ (Nasdaq-100)
- 46.4%
- VOO (S&P 500)
- 39.1%
Information technology
- QQQ (Nasdaq-100)
- 57.7%
- VOO (S&P 500)
- 39.7%
Financials
- QQQ (Nasdaq-100)
- 0.2%
- VOO (S&P 500)
- 11.3%
Health care
- QQQ (Nasdaq-100)
- 4.6%
- VOO (S&P 500)
- 9.3%
Energy
- QQQ (Nasdaq-100)
- 0.5%
- VOO (S&P 500)
- 3.4%
Those figures come from Overlap Monitor's reading of the issuers' holdings files. A separate calculator, the etf.net overlap tool, also reports 55.2% overlap by weight for the pair and shows shared holdings making up 93.0% of QQQ and 56.0% of VOO. It counts 86 shared positions rather than 87, a difference that comes from file dates and from how share classes such as Alphabet's A and C shares are matched. When you quote an overlap number, record the tool and the holdings date alongside it.
Holdings count versus weight overlap
Counting names makes the funds look far apart: 87 shared positions is only about 17% of VOO's lineup. Weighting them tells a different story. NVIDIA (8.1% of QQQ, 8.4% of VOO), Apple (8.0%, 7.4%), Microsoft (6.2%, 5.8%) and Amazon (4.1%, 3.7%) are near the top of both funds. Meanwhile the 417 companies found only in VOO are mostly small positions. Duplicated exposure is about money, not tickers, so weight overlap is the more useful measure.
The ETF overlap formula and how to calculate it yourself
Most ETF overlap calculators use the same rule. For every stock both funds own, take the smaller of its two weights, then add those values up. If a stock is 6% of QQQ and 4% of VOO, only 4% counts as shared. The result runs from 0% (nothing in common) to 100% (identical portfolios). Cash, futures and currency contracts are usually left out.
- 1
Download both holdings files
Most issuers publish a full holdings list as a spreadsheet or CSV. Note the as-of date on each file and, where possible, compare files from the same date.
- 2
Match holdings by identifier
Company names vary between files, so match on ticker, CUSIP or ISIN. Decide whether to treat multiple share classes of one company as a single holding and apply that rule consistently.
- 3
Sum the smaller weights
In a spreadsheet, compute MIN(weight A, weight B) for each shared row and SUM the column. Separately summing each fund's weight in shared names tells you what share of QQQ is also in VOO and vice versa.
- 4
Compare sectors and top holdings
A single overlap figure hides concentration. Put the two funds' sector tables side by side and look for the biggest gaps, then check the combined top 10.
Free diversification calculators save time, but expect results between about 52% and 56% depending on the holdings dates each tool uses. That spread reflects rebalancing and price moves, not a math error. Because the biggest shared names can shift weight sharply after quarterly results, the theddari earnings calendar is a practical way to see when companies like NVIDIA or Microsoft report, which helps explain sudden changes in holdings files.

What owning both does to your portfolio
For portfolio diversification, the useful question is not whether the funds overlap but what changes when you combine them. Multiply each fund's weights by your allocation and add them. The table below applies that simple arithmetic to the fall 2026 figures above.
100% VOO
- Info tech
- 39.7%
- Financials
- 11.3%
- NVIDIA
- 8.4%
- Micron
- 1.8%
70% VOO / 30% QQQ
- Info tech
- 45.1%
- Financials
- 8.0%
- NVIDIA
- 8.3%
- Micron
- 2.6%
50% VOO / 50% QQQ
- Info tech
- 48.7%
- Financials
- 5.8%
- NVIDIA
- 8.3%
- Micron
- 3.2%
100% QQQ
- Info tech
- 57.7%
- Financials
- 0.2%
- NVIDIA
- 8.1%
- Micron
- 4.6%
For the 70/30 mix, technology is 0.7 × 39.7% + 0.3 × 57.7% ≈ 45.1%. Notice that NVIDIA barely moves because both funds hold it at similar weights. Stocks that are much larger in QQQ, such as Micron, and the technology sector as a whole grow as you add QQQ, while financials shrink. In practice, pairing the two funds works like adding a growth and technology tilt to an S&P 500 core.
Whether that tilt is a problem depends on your intent. If you want more exposure to large growth companies, the result may match your plan. If you bought a second fund expecting to spread risk, the combination actually makes a few mega-cap technology stocks matter more. The SEC's investor education site, Investor.gov, makes the same point: even if you hold several funds and think you are diversified, check their top holdings to confirm they are different.
The unique holdings are where diversification comes from
The 15 positions only in QQQ, worth 6.8% of the fund, are mostly non-US or not-yet-added names such as Shopify, ASML, Arm and MercadoLibre. The 417 positions only in VOO, worth 44.1%, include Berkshire Hathaway, Eli Lilly and JPMorgan Chase, which tilt toward financials, health care and energy (etf.net). If you already own QQQ, adding VOO brings genuinely new sectors. If you already own VOO, adding QQQ mainly raises the weight of companies you already have.
Limits of overlap numbers
- Overlap is a snapshot. Rebalancing, index additions and price moves change it, so always record the as-of date.
- Low overlap does not mean low correlation. Different companies in the same industry or exposed to the same economic forces are not counted as overlap.
- Overlap says nothing about future returns or volatility. Which index performed better in the past is separate information.
- Expense ratios, tax treatment and account rules differ by fund, listing country and your residence. Check the prospectus and the rules for your account type before switching.
Strong claims such as never owning both funds, or that the Nasdaq-100 alone is enough, circulate widely online. Ask whether the argument rests on overlap, past performance or a personal factor such as how close the speaker is to retirement. The theddari stock Telegram trends page shows which funds and sectors investors are discussing, but chatter volume is not evidence of suitability.
A checklist for your own ETF holdings comparison
- List every fund and individual stock you own, with the dollar amount in each account.
- Download each fund's holdings file and note its date.
- Calculate weight overlap for each pair, or check it with a calculator that shows its method and dates.
- Weight each fund by your allocation to get the combined top 10 and sector mix.
- Decide whether the largest stock and sector weights are tilts you chose and can tolerate.
- If you rebalance, check tax consequences and trading costs first, and set a date for the next review.
In short, holding an S&P 500 ETF and a Nasdaq-100 ETF together means buying much of the same portfolio twice, which raises your weight in technology and mega-caps. On fall 2026 holdings data, weight overlap was about 55%, and more than 90% of QQQ was in S&P 500 companies. The decision is less about the label redundant and more about whether the combined sector and top-holding weights fit your time horizon and tolerance for losses.