Contents8 sections
- What sequence of returns risk means
- Why the years around retirement are the danger zone
- Asset allocation near retirement: think in roles, not one number
- A retirement withdrawal strategy that bends instead of breaks
- Concentration risk: one house, one rental or one stock
- A five-year pre-retirement checklist
- Frequently asked questions
- Sources and references
Sequence of returns risk is the main reason retirement investing at 60 looks different from investing at 35. While you are still adding money, a bad year early or late makes no difference to where a lump sum ends up. Once you start withdrawing living expenses, losses in the first years can permanently shrink the base that has to fund the rest of your retirement. This guide, based on sources reviewed as of October 2026, explains how the risk works, why it concentrates around the retirement date, and how investors in their 50s and 60s can check their allocation, cash buffer, withdrawal rules and concentration before they stop working. Pension rules mentioned are labeled by country; check the rules where you live.
What sequence of returns risk means
Morningstar's explanation starts with a simple point. If you invest a lump sum and make no additions or withdrawals, your total return is the same whatever order the yearly returns arrive in. Multiplication does not care about order. Add regular withdrawals, though, and timing starts to matter, because each sale locks in whatever price the market offers that year.
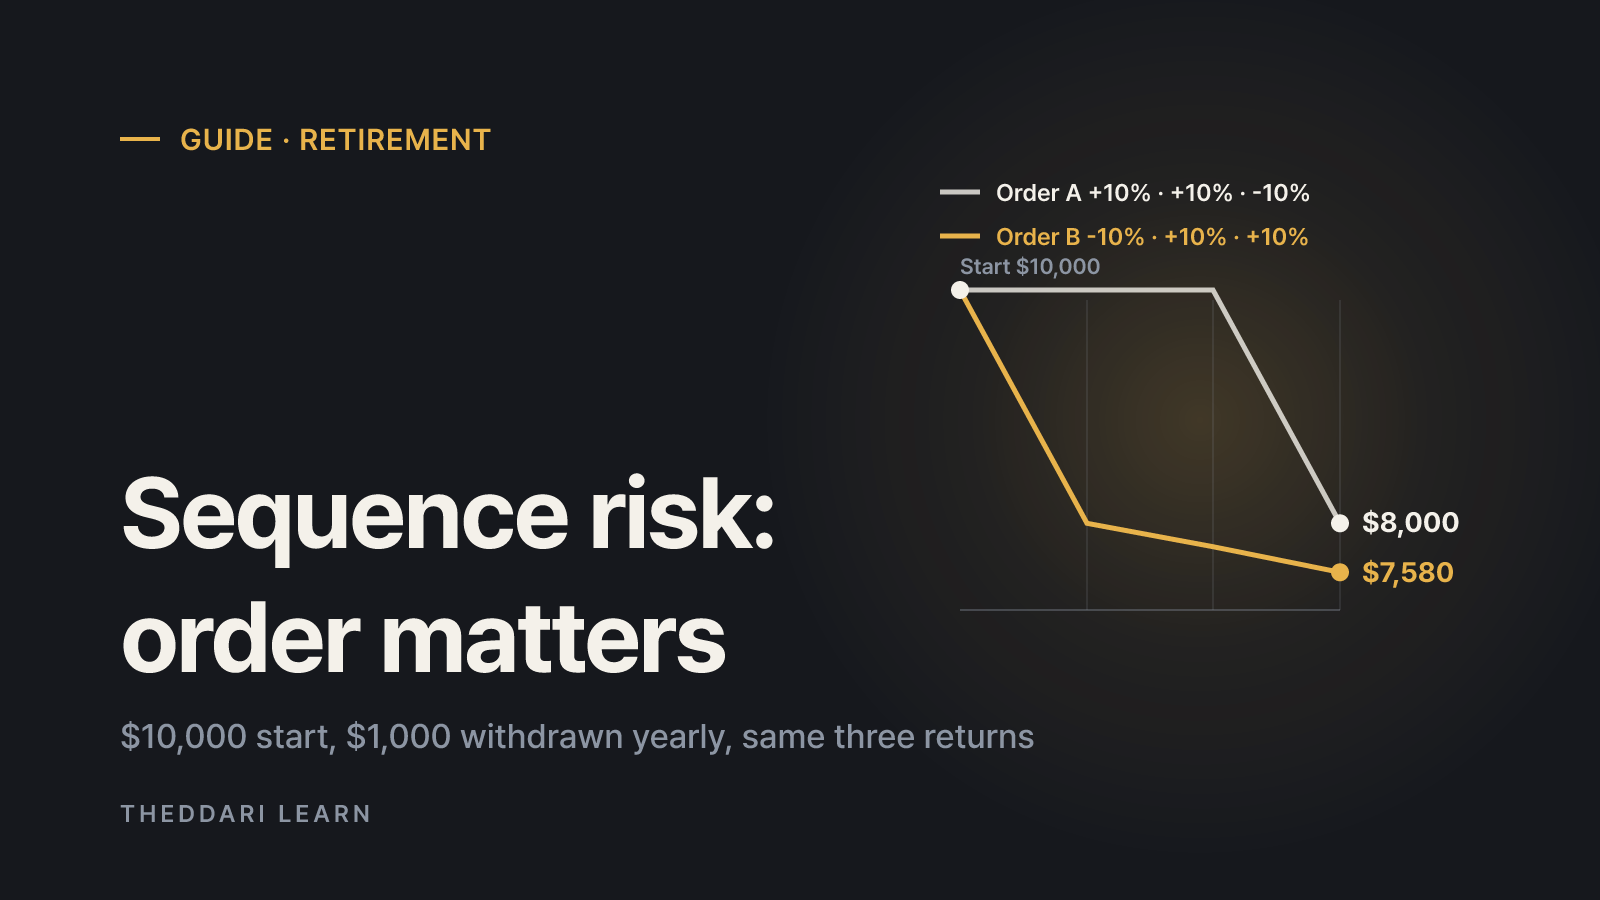
Morningstar's own small example uses a $10,000 portfolio, a $1,000 withdrawal each year and returns of +10%, +10% and -10%. The table below works through it, assuming withdrawals at year-end and ignoring fees and taxes.
Order A (+10%, +10%, -10%) with withdrawals
- End of year 1
- $10,000
- End of year 2
- $10,000
- End of year 3
- $8,000
Order B (-10%, +10%, +10%) with withdrawals
- End of year 1
- $8,000
- End of year 2
- $7,800
- End of year 3
- $7,580
No withdrawals (either order)
- End of year 1
- -
- End of year 2
- -
- End of year 3
- $10,890
Without withdrawals both paths end at $10,890. With withdrawals, the path that starts with a loss ends $420 lower after only three years. The $1,000 taken out after the drop is a bigger slice of a smaller balance, and the later gains compound on less money. Over a 20- or 30-year retirement, that gap can change how long the money lasts.
Why the years around retirement are the danger zone
Morningstar also ran the idea through real market history. A hypothetical 65-year-old retiring in 2000 with $1,000,000 entirely in US stocks, withdrawing $40,000 in the first year and raising that by 3% annually, saw the portfolio nearly cut in half by the end of the third year. Because so much had been sold at low prices, the dollar recovery after 2003 was muted, and the 2008 decline hit again. By age 85 the balance was about $644,000. Running the same 2000-2020 returns in reverse order left close to $2.7 million.
The same retiree with a 60% stock and 40% bond portfolio, rebalanced annually, fell to a low of about $729,000 after 2008 and climbed back to $1.2 million by age 84. Morningstar notes these are extreme examples because few retirees begin withdrawals with an all-stock portfolio. The lesson is structural: the balance is largest and the remaining withdrawal period longest right around the retirement date, so losses then do the most lasting damage. A crash shortly before retirement is risky for the same reason, because withdrawals then begin from a smaller base.
Historical sequences illustrate the mechanism only. They do not forecast future returns or the order in which they will arrive.
Asset allocation near retirement: think in roles, not one number
The SEC's Investor.gov describes asset allocation as dividing investments among stocks, bonds and cash, and calls it a personal decision that changes over your life with your time horizon and risk tolerance. Rather than searching for the right stock percentage for a 60-year-old, it is often more practical to split money by when it will be spent. The ranges below are a common framework, not a recommendation; the right sizes depend on your spending, other income, health and tolerance for losses.
Spending buffer
- When it is spent
- Next 1-2 years
- Typical holdings
- Cash, savings, short-term instruments
- Risk to watch
- Inflation erodes purchasing power
Cushion
- When it is spent
- Roughly years 3-10
- Typical holdings
- Bonds, bond funds
- Risk to watch
- Interest-rate moves; bonds and stocks can fall together
Growth
- When it is spent
- Year 10 and beyond
- Typical holdings
- Stocks, stock funds and ETFs
- Risk to watch
- Large swings; pressure to sell in a downturn
Morningstar points to the bucket approach: keep at least one or two years of planned withdrawals in a separate cash bucket, spend from it during a downturn, and leave the stock portion invested so it has time to recover. Refill the bucket when markets are stronger. It is not a perfect shield. Too much cash can lag inflation for decades, and bonds can lose value when rates rise.
Rebalancing keeps the plan honest. Investor.gov gives the example of a 60% stock target that drifts to 80% after a rally; you would sell some stock or add to other assets to restore the mix. Some people rebalance every six or twelve months, others when a holding moves outside a preset band, and Investor.gov notes it tends to work best when done relatively infrequently. Target date funds handle this internally and become more conservative as the target date approaches. Check trading costs and tax consequences before you rebalance.
A retirement withdrawal strategy that bends instead of breaks
A fixed, inflation-adjusted withdrawal is easy to plan but rigid when markets fall. Morningstar lists more flexible alternatives: withdrawing a fixed percentage of the current balance each year, skipping inflation increases in bad years, or using guardrails that cut spending when a falling balance pushes the withdrawal rate too high. Each one trades some income stability for a longer-lasting portfolio.
- 1
Separate essential and flexible spending
List costs you cannot easily cut, such as housing, food and healthcare, apart from travel and gifts. The more you can trim in a bad year, the less sequence risk can hurt you.
- 2
Measure what guaranteed income covers
Add up pensions, Social Security or other public pensions, annuity payments and any part-time earnings. The shortfall against essential spending is what the portfolio must supply.
- 3
Recalculate your withdrawal rate every year
Divide the year's planned withdrawal by the current balance. If a decline pushes the rate above a ceiling you set in advance, reduce flexible spending first rather than selling more assets at low prices.
Public pension timing interacts with all of this. Claiming later usually raises lifetime monthly income but lengthens the gap the portfolio must fill; claiming earlier does the reverse. For readers in South Korea, the National Pension Service sets the old-age pension start at 65 for people born in 1969 or later. Early pension can begin up to five years sooner, at 70% of the basic amount if taken five years early, and is suspended while you have qualifying earned income. Deferral of up to five years adds 7.2% per year. Other countries' rules differ, so compare the bridge-years withdrawal against the higher lifetime payment under your own system.
Concentration risk: one house, one rental or one stock
Stories of retirees losing their savings in a single stock, or building retirement around rental houses that did not work out, share one feature: too much in one place. FINRA defines concentration risk as amplified losses from holding a large portion of a portfolio in one investment, asset class or market segment. It can come from deliberate bets, from one asset outgrowing the rest, from holding an employer's stock in a retirement account, or from owning several assets that move together. FINRA also warns that illiquid holdings such as non-traded REITs or private placements may be hard to sell quickly or at an efficient price, and that owning several funds does not help if their top holdings overlap.
Real estate weight is especially high in some countries. Korea's 2025 Survey of Household Finances and Living Conditions found that, as of March 2025, real assets made up about 76% of average household assets, with financial assets about 24%. Whatever your country, a home is difficult to spend from without selling or borrowing, so plan the withdrawal stream from liquid assets separately. If individual stocks still form a large share of your portfolio, the theddari earnings calendar can help you see when reports may bring sharper moves; confirm dates with company filings and use them as review points, not price forecasts.

A five-year pre-retirement checklist
Bond and cash yields respond to interest rates and inflation, so scheduled central bank decisions and inflation releases are natural dates to review your cushion and rebalancing bands. The theddari economic calendar lists those events; it shows timing, not market direction.
- Put every pension, retirement account and expected start date on one page.
- Estimate the gap between your last paycheck and your public pension start, and the total spending needed to bridge it.
- Decide whether to hold a one- to two-year cash buffer and how large it should be.
- Write down target weights by role and a rebalancing rule, either calendar-based or band-based.
- Calculate what share of your net worth sits in one home, one property, one employer or one sector.
- Set in advance how much you could cut withdrawals in a downturn and which spending goes first.
The core change in your 50s and 60s is not chasing a higher return but protecting how long the money lasts once withdrawals begin. A cash buffer, a bond cushion, flexible withdrawal rules, a deliberate pension start date and a concentration check work best as one plan. Tax, healthcare and pension rules vary by jurisdiction and change over time, so confirm the current official guidance where you live before acting.