Contents7 sections
Portfolio diversification is the practice of spreading your money across investments that react differently to the same market conditions, so that a loss in one area can be partly cushioned by others. What matters is not how many positions you hold but how differently they move. As of October 2026, this guide draws on investor education from the U.S. Securities and Exchange Commission (SEC) and the standard two-asset portfolio formula to show how to measure the diversification effect, what allocation percentages look like for different risk profiles, and how to check your own mix. All volatility and correlation figures below are assumptions chosen to illustrate the math, not forecasts for any market.
Portfolio diversification meaning: why it reduces risk
The SEC's Investor.gov page on asset allocation defines diversification as spreading money among different investments to reduce risk, summed up as "don't put all your eggs in one basket." Market conditions that hurt one asset class may help another, so holding several classes gives you a chance to offset losses in one with gains or stability in another.
The SEC's Beginners' Guide to Asset Allocation, Diversification, and Rebalancing uses a street vendor who sells umbrellas and sunglasses. On rainy days umbrellas sell; on sunny days sunglasses do. Selling both lowers the chance of a day with no sales at all. In investing, stocks, bonds and cash equivalents play similar roles. Keep in mind that diversification aims to smooth the ride; it cannot guarantee against losses.
Asset allocation and diversification are related but different
Asset allocation is the decision about how much goes into each asset category. Diversification is how you spread money within and across those categories. The SEC points out that a 25-year-old putting everything in stocks for retirement, or a family holding only cash for a house down payment, may have reasonable allocations for their goals, yet neither is trying to reduce risk by mixing asset types. Diversification works on two levels: between asset categories, and within each one by company, industry, size and region.
The diversification formula: correlation does the work
A portfolio's expected return is a simple weighted average, but its risk is not. The standard two-asset variance formula, as laid out in this CFA Level I study note, is:
σp² = w1²σ1² + w2²σ2² + 2·w1·w2·ρ·σ1·σ2
Here w is each asset's weight, σ is each asset's standard deviation (volatility) and ρ is the correlation between their returns, which ranges from -1 to +1. Take the square root to get portfolio standard deviation. When ρ equals +1, portfolio volatility equals the weighted average of the two volatilities. Every step below +1 pulls it lower, and that gap is the diversification benefit.
Worked example: a 60/40 stock-bond mix
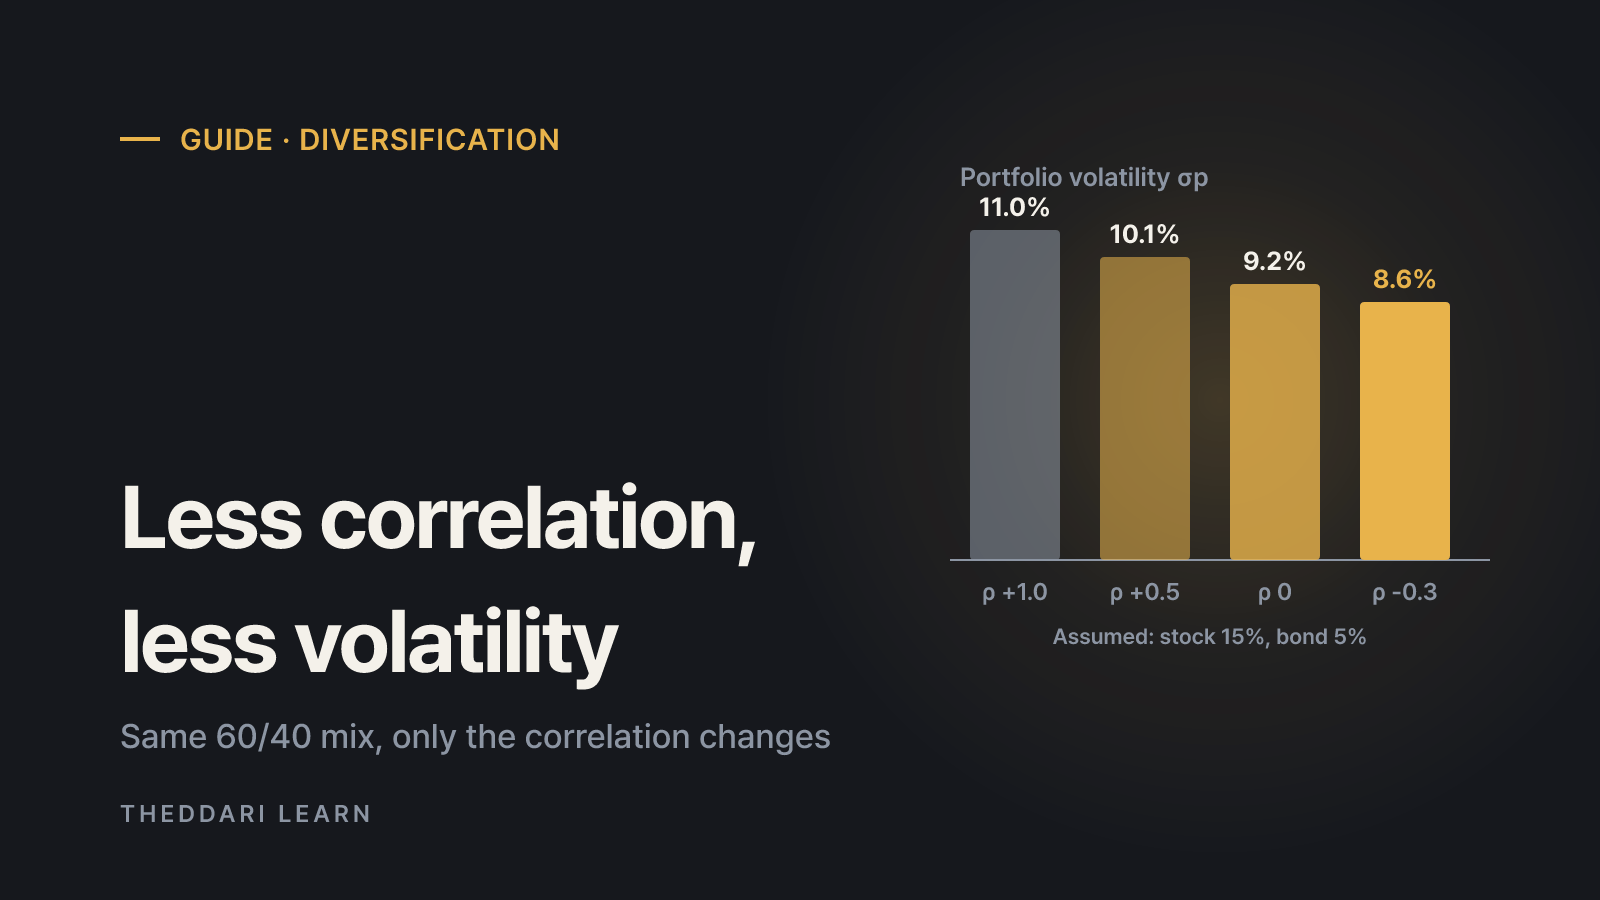
Assume 60% in stocks with 15% annual volatility and 40% in bonds with 5% annual volatility. The pieces are 0.6² × 0.15² = 0.0081, 0.4² × 0.05² = 0.0004, and the covariance coefficient 2 × 0.6 × 0.4 × 0.15 × 0.05 = 0.0036. The weighted-average volatility is 0.6 × 15% + 0.4 × 5% = 11.0%. Here is what changing only the correlation does:
+1.0
- Portfolio variance
- 0.0121
- Portfolio volatility σp
- 11.0%
- Reduction vs. weighted average
- 0 points (no benefit)
+0.5
- Portfolio variance
- 0.0103
- Portfolio volatility σp
- about 10.1%
- Reduction vs. weighted average
- about 0.9 points
0
- Portfolio variance
- 0.0085
- Portfolio volatility σp
- about 9.2%
- Reduction vs. weighted average
- about 1.8 points
-0.3
- Portfolio variance
- 0.00742
- Portfolio volatility σp
- about 8.6%
- Reduction vs. weighted average
- about 2.4 points
The weights and individual volatilities never change, yet portfolio risk falls as correlation falls. Correlation does not enter the expected-return calculation, which is why diversification is often described as lowering risk without necessarily giving up expected return. The study note's own example (60/40, volatilities of 15% and 8%, correlation 0.25) lands at about 10.28% against a 12.2% weighted average. Real-world volatilities and correlations are estimates that shift with the measurement window, so treat any single number with caution.
Why adding more stocks eventually stops helping
For N equally weighted assets, portfolio variance works out to the average individual variance divided by N plus the average covariance multiplied by (N − 1)/N. As N grows, the first term shrinks toward zero but the second converges to the average covariance. In plain terms, adding names removes company-specific risk, but the market-wide risk that all holdings share remains. That is why combining different asset classes can matter more than buying dozens more large-cap stocks from the same market.
Asset allocation percentages: examples by risk profile
The SEC stresses that asset allocation is a personal decision driven mainly by time horizon and risk tolerance, and that no single model fits every goal. The mixes below are illustrations of how profiles differ, not recommendations.
Conservative
- Stocks
- 30%
- Bonds
- 60%
- Cash equivalents
- 10%
- Typical situation (illustrative)
- Goal is near and swings in value are hard to tolerate
Moderate
- Stocks
- 60%
- Bonds
- 35%
- Cash equivalents
- 5%
- Typical situation (illustrative)
- Medium- to long-term goal, can accept moderate declines
Aggressive
- Stocks
- 80%
- Bonds
- 15%
- Cash equivalents
- 5%
- Typical situation (illustrative)
- Long horizon and able to ride out large temporary drops
After choosing the split, diversify inside each bucket: domestic and international stocks, large and small companies, several sectors; bonds across maturities and issuers. The SEC also mentions target-date (lifecycle) funds, which shift toward a more conservative mix as the target year approaches and handle rebalancing for you. If you add assets such as crypto, understand their specific risks first. Investors who buy crypto on Korean exchanges, for example, often check the price gap against overseas venues before trading.

How to check your portfolio's diversification
- 1
Total your weights by asset class
Combine every account, including brokerage, retirement plans, savings and crypto, and sort holdings into stocks, bonds, cash and other. Classify funds by what they actually hold, not by their names.
- 2
Measure concentration
Square each weight (as a decimal), add them up and take the reciprocal to estimate an effective number of holdings. A 60/40 mix gives 1 ÷ (0.36 + 0.16) ≈ 1.9; five assets at 20% each give 5. Lower numbers mean heavier concentration.
- 3
Look for overlap
The SEC advises checking the top holdings of every mutual fund or ETF you own. Three differently named funds that all lean on the same large tech companies offer less diversification than their count suggests.
- 4
Set targets and drift bands
In the SEC's example, a 60% stock target can grow to 80% after a rally, raising your risk level. Decide in advance whether you will review every six or twelve months, or whenever a weight drifts beyond a band such as five percentage points.
Major economic releases can move several asset classes at once. Knowing when they are scheduled can help you avoid reacting to short-lived price swings when you review your weights. A calendar is a scheduling aid, not a price forecast.
Limits and risks of diversification
- Correlations change. Estimates based on past data vary by period, and in sharp sell-offs many assets can fall together, weakening the effect when you need it most.
- Costs add up. The SEC notes that adding more investments usually brings more fees and expenses, which lower returns. Compare costs when you add a fund for diversification.
- Rebalancing has frictions. Selling to rebalance can trigger trading fees and taxes. Directing new contributions toward under-weighted assets is one way the SEC describes to reduce that. Tax treatment depends on your country and account type, so check the official rules that apply to you.
- Diversification does not guarantee returns. You may give up some of the upside of your best-performing asset in exchange for a smoother path.
In short, diversification is less about owning many things and more about holding assets that behave differently, in proportions you can stick with. Working through the formula shows why correlation matters, and a quick concentration and overlap check shows where your own portfolio may be leaning. Start from your time horizon and risk tolerance, not from someone else's percentages.
This AI-written guide is general information and is not investment advice. The volatility, correlation and allocation figures are assumptions and illustrations for explaining the math, not recommendations for any product or mix. Check current official sources and your own circumstances, and consult a qualified professional if needed.