Contents6 sections
The short answer on the midterm election stock market pattern: since 1950, the S&P 500 has been higher 12 months after every one of the 19 US midterm elections. That record is real, but the headline average shifts with the start date, it usually excludes dividends, and 19 observations cannot carry much statistical weight. This guide, written as of November 2, 2026, the day before the November 3 midterms, walks through the JPMorgan, TradingView and RBC figures reviewed for this article and explains what they can and cannot tell you.
Viral videos promising to reveal what happens after every midterm since 1950 tend to quote one average and move on. Depending on which table they borrow from, that number might be 15.1% or 16.6%. Knowing why those figures differ is the fastest way to separate a useful base rate from a sales pitch.
The midterm election stock market record since 1950
Midterms fall in the second year of a presidential term, when all 435 House seats and about a third of the Senate are on the ballot. The so-called midterm cycle bundles two observations: midterm years have tended to be the weakest of the four-year presidential cycle, and the 12 months after the vote have tended to be among the strongest.
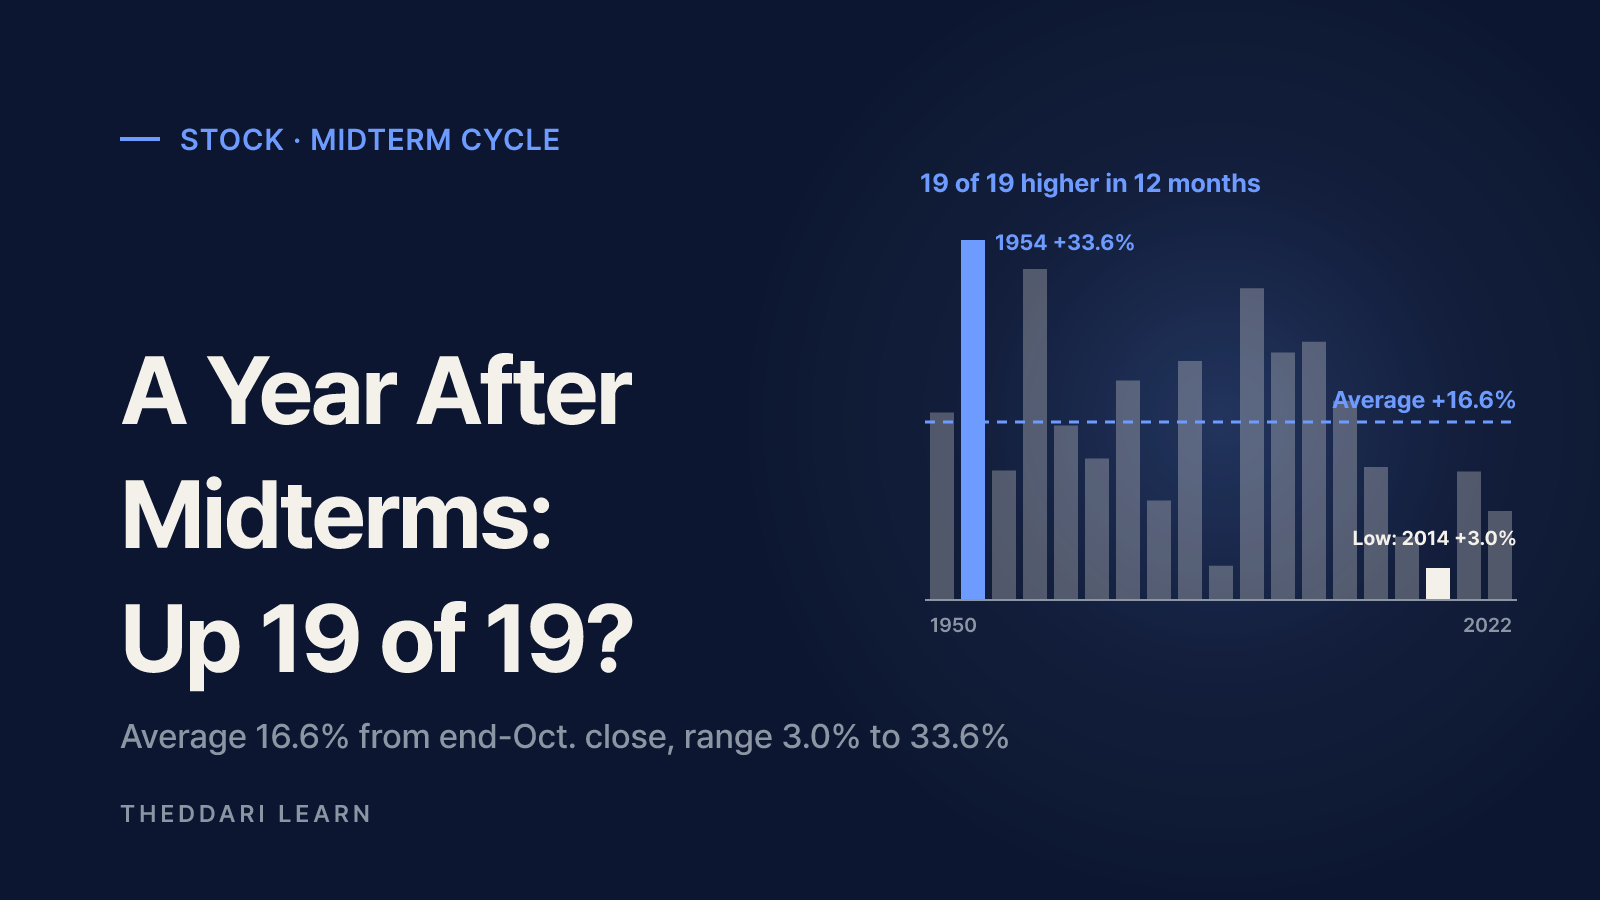
TradingView data cited by Benzinga start from the last close of October in each midterm year. On that basis the index was higher a year later in all 19 cases, with an average gain of 16.6% and a median of 16.3%. The weakest run, October 2014 to October 2015, was about 3%. The strongest, after the 1954 vote, was 33.6%.
1950
- End of Oct. to Dec. 31
- +4.6%
- 12 months after end of Oct.
- +17.5%
1954
- End of Oct. to Dec. 31
- +13.6%
- 12 months after end of Oct.
- +33.6%
1958
- End of Oct. to Dec. 31
- +7.6%
- 12 months after end of Oct.
- +12.1%
1962
- End of Oct. to Dec. 31
- +11.6%
- 12 months after end of Oct.
- +30.9%
1966
- End of Oct. to Dec. 31
- +0.2%
- 12 months after end of Oct.
- +16.3%
1970
- End of Oct. to Dec. 31
- +10.7%
- 12 months after end of Oct.
- +13.2%
1974
- End of Oct. to Dec. 31
- -7.2%
- 12 months after end of Oct.
- +20.5%
1978
- End of Oct. to Dec. 31
- +3.2%
- 12 months after end of Oct.
- +9.3%
1982
- End of Oct. to Dec. 31
- +5.2%
- 12 months after end of Oct.
- +22.3%
1986
- End of Oct. to Dec. 31
- -0.8%
- 12 months after end of Oct.
- +3.2%
1990
- End of Oct. to Dec. 31
- +8.6%
- 12 months after end of Oct.
- +29.1%
1994
- End of Oct. to Dec. 31
- -2.4%
- 12 months after end of Oct.
- +23.1%
1998
- End of Oct. to Dec. 31
- +11.9%
- 12 months after end of Oct.
- +24.1%
2002
- End of Oct. to Dec. 31
- -0.7%
- 12 months after end of Oct.
- +18.6%
2006
- End of Oct. to Dec. 31
- +2.9%
- 12 months after end of Oct.
- +12.4%
2010
- End of Oct. to Dec. 31
- +6.3%
- 12 months after end of Oct.
- +5.9%
2014
- End of Oct. to Dec. 31
- +2.0%
- 12 months after end of Oct.
- +3.0%
2018
- End of Oct. to Dec. 31
- -7.6%
- 12 months after end of Oct.
- +12.0%
2022
- End of Oct. to Dec. 31
- -0.8%
- 12 months after end of Oct.
- +8.3%
Average / times higher
- End of Oct. to Dec. 31
- +3.6% / 13 of 19
- 12 months after end of Oct.
- +16.6% / 19 of 19
Two things stand out. Every 12-month figure is positive, yet the spread runs from 3.0% to 33.6%, a gap of more than ten times. And the short window from late October to year-end was positive in only 13 of 19 years. In 2018 the index fell 7.6% over those final two months, the worst post-midterm stretch in the sample, then finished the 12-month window up 12.0%. A single average erases those very different paths.
Why the midterm year itself tends to lag
In the same report, Bank of America technical strategist Paul Ciana noted that since 1940 the S&P 500 averaged a 4.22% gain in midterm years, compared with 8.85% across all years. The fourth quarter of midterm years flipped that, rising 86% of the time by an average of 6.6%. RBC Wealth Management examined 22 midterm periods since 1934 and found the index typically fell 20.6% at some point in the 12 months before the vote, then rallied an average of 46.9% from that low to the following year's high, with a range of 14.7% to 87.1%.
Why midterm cycle numbers differ from source to source
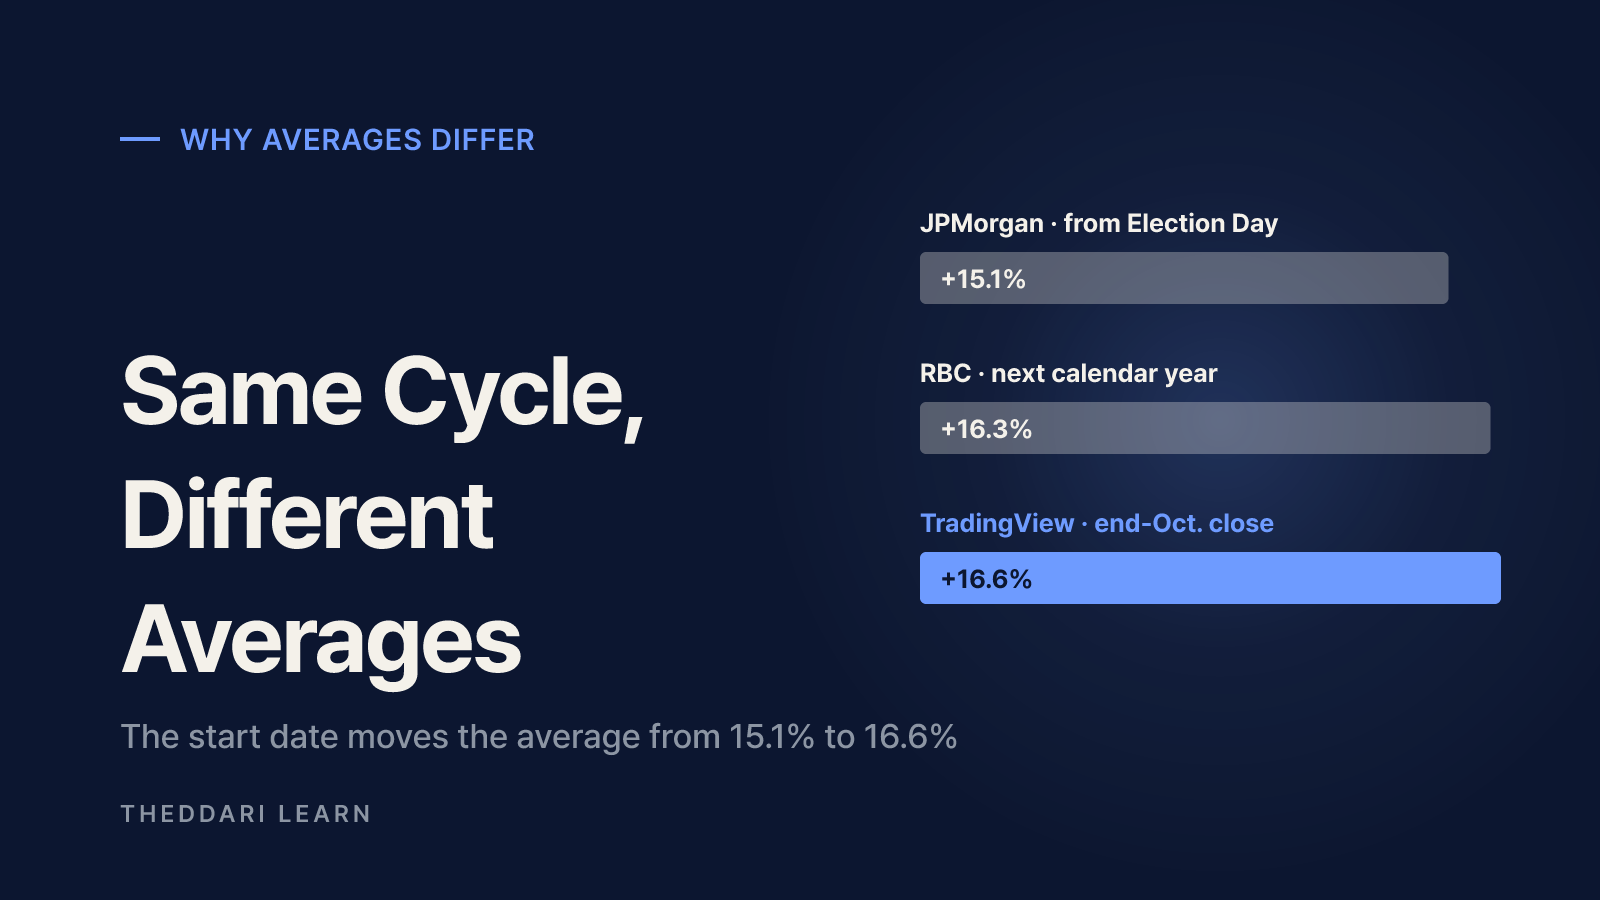
Different averages usually reflect different questions, not bad math. JPMorgan's analysis, as reported by Moneywise, measured the 12 months after each midterm from 1950 to 2022 and found an average of 15.1%. TradingView's end-of-October start produces 16.6%. RBC measured the calendar year after the midterm since 1932 and reported a 16.3% average, with a low of -5.2% and a high of 41.4%.
JPMorgan (via Moneywise)
- Start and window
- 12 months after the election
- Sample
- 1950-2022, 19 midterms
- Average
- +15.1%
- Caveat
- 1986 cycle returned low single digits
TradingView (via Benzinga)
- Start and window
- 12 months after end-of-Oct. close
- Sample
- 1950-2022, 19 midterms
- Average
- +16.6%
- Caveat
- Starts days before the vote
RBC
- Start and window
- Calendar year after the midterm
- Sample
- Since 1932
- Average
- +16.3%
- Caveat
- Range -5.2% to +41.4%
Seasonax (via Benzinga)
- Start and window
- 5 trading days before to 2 days after
- Sample
- 23 midterms since 1934
- Average
- +2.74%
- Caveat
- Up 22 times; 1994 was the miss
Moving the start by a few days can shift the average by more than a percentage point. If stocks often rallied between late October and Election Day, an end-of-October base will show a higher average. Most of these studies use price returns, so they are not directly comparable with total-return figures that include dividends. Calendar-year studies skip the first two post-election months entirely, so they measure a different year even when the label sounds similar.
Four checks before you trust a midterm statistic
- Start date: Election Day close, end of October, or January 1 of the following year.
- Window: 12 months, a calendar year, or low-to-high, which flatters results.
- Sample: post-1950 data exclude the 1930s and 1940s, when some outcomes were negative.
- Return type: price-only versus total return, and the currency you actually invest in.
Limits of using the midterm cycle as a trading signal
Sample size is the first problem. Nineteen elections is a small base, so one or two unusual years can move the average a lot, and it is hard to tell a lasting pattern from coincidence. Benzinga's own summary called 19 midterms a small sample and described history as a tailwind, not a guarantee. A well-known pattern can also weaken once enough investors try to front-run it.
The second problem is confounding. Post-midterm years have often coincided with Fed easing, economic recoveries and rebounding profits. RBC argued that monetary policy, the economy and earnings trends have stronger links to stock prices than anything coming out of Washington, and found that in seven midterm periods marked by inflation, the market reached a new high in the following year less often. The election may simply share a calendar with the forces that actually moved prices.
What is different heading into November 2026
According to Benzinga, the S&P 500 closed at 7,676.77 on October 26, 2026, up 11.6% for the year and about 2.1% below its record of 7,844.52. That means this midterm arrives after a gain, not a deep drawdown. It is also the second year of President Trump's second term; in 2018, the second year of his first term, the index ended the year down more than 6.5%. Yardeni Research flagged an escalation of the Middle East war as its main concern, and Pantheon Macroeconomics expects divided government to freeze fiscal policy. None of those conditions are captured in a 19-election average.
Midterm statistics describe the S&P 500 price index. They do not transfer directly to single stocks, sector bets or leveraged ETFs, and the months right after the vote can bring a sharp decline before any recovery, as 2018 showed.
A practical checklist around the 2026 midterms
- 1
Write down the source and method
When a video or article quotes a midterm average, note who calculated it, the start date and whether it is a price or total return. Do not compare numbers built on different bases.
- 2
Put non-election events on the same calendar
The Fed holds eight regularly scheduled FOMC meetings a year. Confirm the next date on the Fed's own calendar and add key inflation and jobs releases plus major earnings reports. Those events can move markets more than the vote in the weeks ahead.
- 3
Set your horizon and loss tolerance first
A 12-month statistic assumes you can stay invested for a year. Money you may need within weeks is exposed to post-election volatility instead. Decide your horizon, the drawdown you can tolerate and whether you will invest gradually before reading anything into the pattern.
- 4
Track policy changes after the results
A shift in House or Senate control can change the outlook for spending, tariffs and regulation. Look for sector effects in official announcements and company guidance rather than drawing a market-wide conclusion from the result alone.
The theddari economic calendar lists FOMC meetings and major data releases, and the earnings calendar shows which companies report around the election. These tools organize what is scheduled; they do not predict price direction, so cross-check key dates with the publisher, such as the Federal Reserve's FOMC calendar. For a read on which stories traders are discussing, the stock channel trends page summarizes topics from Telegram stock channels.

The bottom line: 19-for-19 is an accurate description of past S&P 500 price moves measured in a specific way. Whether the average is 15.1% or 16.6%, it hides a wide range of outcomes, and 19 data points cannot separate the election from the rates, growth and earnings cycles that overlap with it. Check the start date, window, sample and return type, then weigh the 2026 rate and earnings calendar and your own time horizon more heavily than the historical average.