AI PCB Stocks: Substrates vs Server Boards, Traps to Avoid
AI PCB stocks split into package substrates, high-layer server boards and materials. See how demand flows and which metrics expose AI hype.
Contents6 sections
Key takeaways
- AI PCB stocks fall into three groups: package substrates under the chip (FC-BGA/ABF), high-layer PCBs for accelerator boards and switches, and the materials both depend on.
- TrendForce estimates PCB value per server more than doubles in Nvidia's Rubin generation, but that value is split unevenly across the chain.
- Samsung Electro-Mechanics' package unit grew 58% year on year in Q3 2026, yet it was only about a quarter of company revenue.
- At TTM Technologies, the five largest customers made up 42% of Q3 2026 sales; customer concentration is the first risk to check.
- Check AI revenue share, customer concentration, capex timing, pricing and margins, and leverage before treating a board maker as an AI winner.
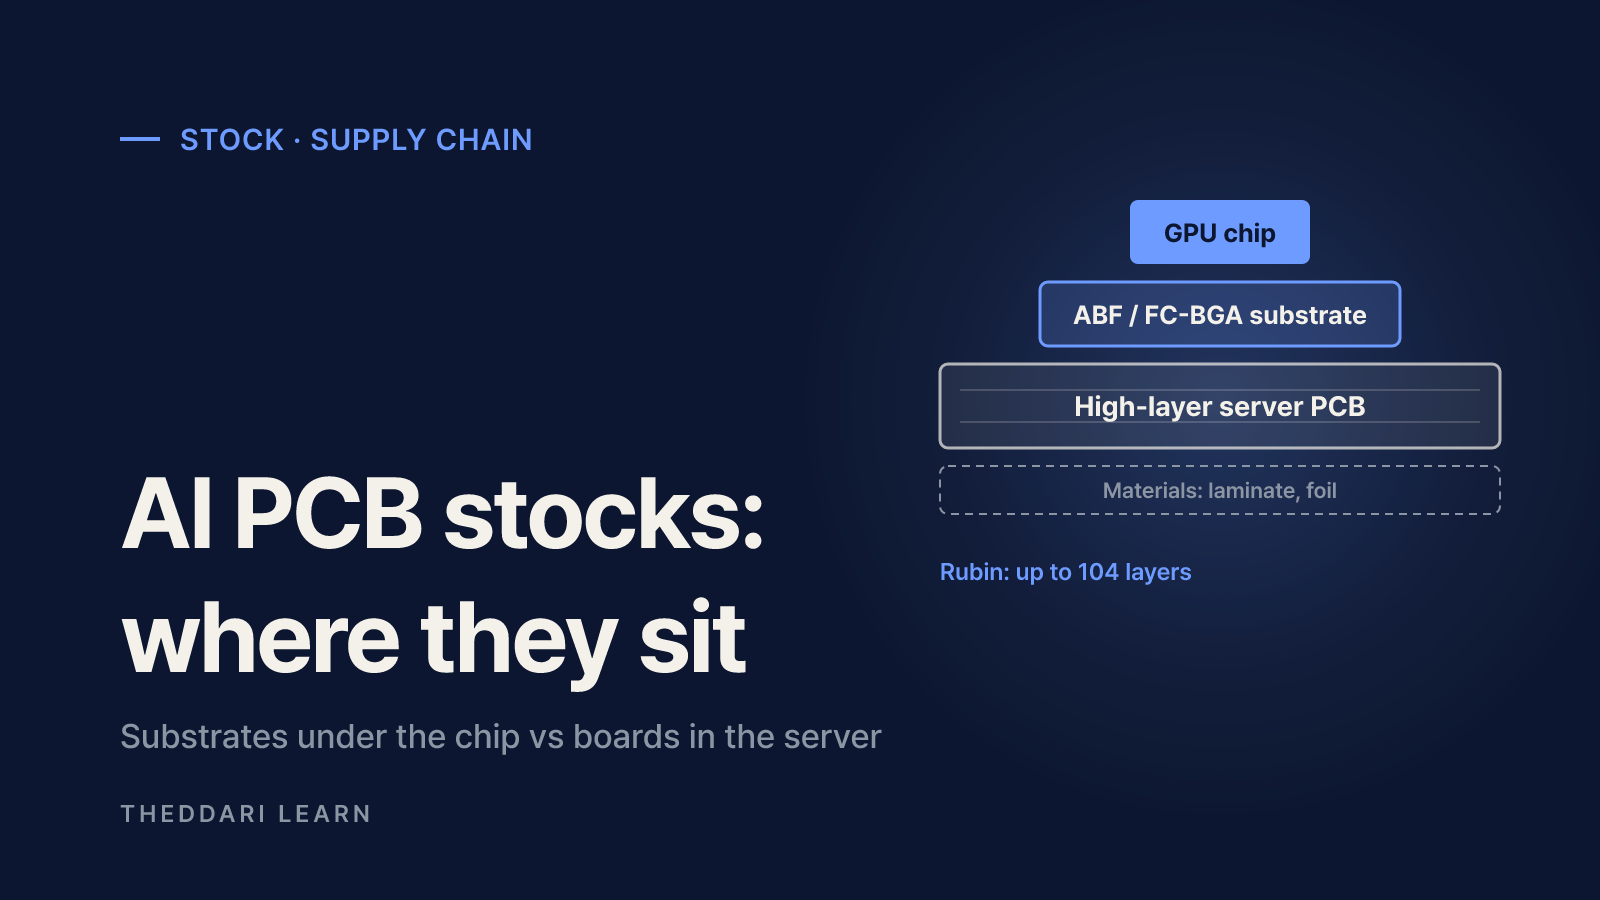
AI PCB stocks are not one trade. The companies grouped under that label sit in three different places in the AI server supply chain: package substrate makers whose ABF or FC-BGA substrates sit directly under GPUs and CPUs, high-layer PCB makers that build accelerator baseboards, switch trays and server motherboards, and materials suppliers that provide the laminates, glass cloth and copper foil both depend on. Each group has its own demand driver, bottleneck and lag before orders show up in earnings. Buying on the theme alone can mean owning a company with little real AI revenue, or one whose AI exposure is real but already priced in and concentrated in a few customers. This guide maps the chain and lists the metrics that separate the two, using filings and research available as of November 2026.
Where the boards sit: the AI server supply chain in three layers
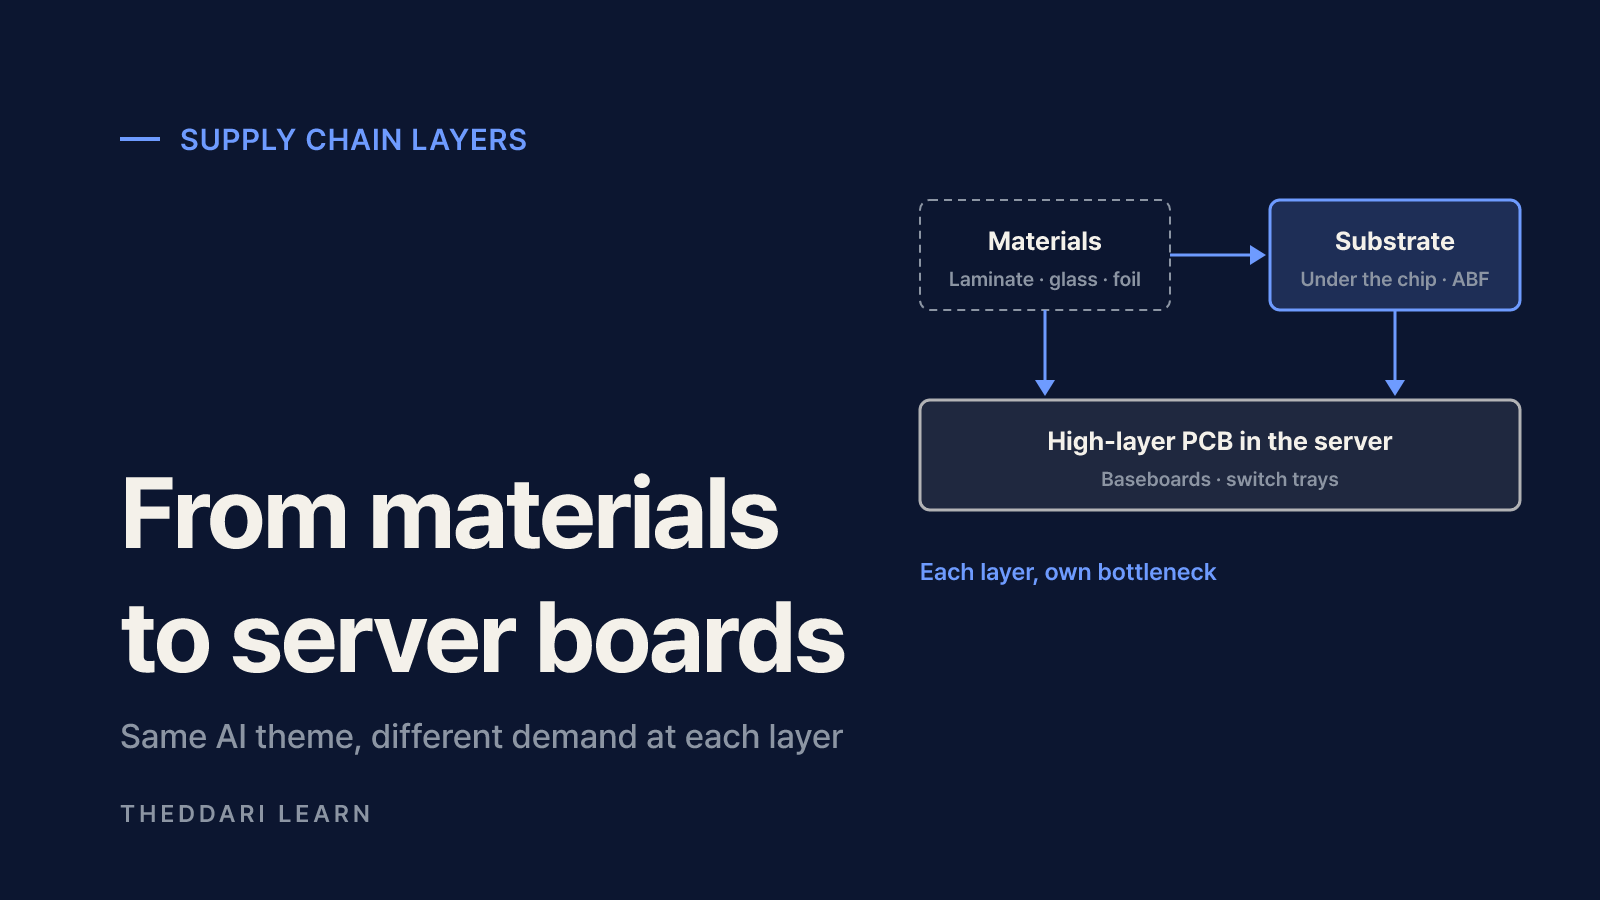
A chip's connection pads are micrometers apart, while traces on a server board are hundreds of micrometers to millimeters apart. The package substrate bridges that gap. As Tom's Hardware explained in September 2026, most high-end CPUs, GPUs and AI accelerators sit on substrates built with Ajinomoto Build-up Film. Only a small group makes them, including Unimicron, Ibiden, Kinsus, Shinko, Samsung Electro-Mechanics and Nan Ya PCB, and Ajinomoto reportedly controls 95% or more of the film market. That concentration is why substrate supply, not just chip supply, can limit accelerator output.
The packaged chip then mounts on a much larger printed circuit board. According to TrendForce's November 2025 research, Nvidia's Rubin-generation servers replace cables between GPUs and switches with multilayer boards. The switch tray uses a 24-layer HDI design, and the midplane and CX9/CPX boards reach up to 104 layers. TrendForce estimates this more than doubles PCB value per server versus the prior generation, and says custom-chip servers such as Google's TPU v7 and AWS Trainium 3 are following the same high-layer, low-loss design path.
Package substrate (ABF / FC-BGA)
- What it does
- Connects the chip to the board
- What limits supply
- Fine-line wiring, warpage on large packages, yield, customer qualification
- Examples often cited
- Ibiden, Unimicron, Samsung Electro-Mechanics
High-layer PCB (MLB / HDI)
- What it does
- Accelerator baseboards, switch trays, server boards
- What limits supply
- Layer registration, signal loss, sequential lamination
- Examples often cited
- TTM Technologies, Isu Petasys
Materials (laminate, glass cloth, copper foil)
- What it does
- Raw inputs for both
- What limits supply
- Low-loss grade capacity and yield
- Examples often cited
- Nittobo, copper-clad laminate makers
Examples show which product group a company discusses in its own disclosures. They do not confirm a supply contract with any specific chip designer or that the business is a large share of revenue. Many companies span more than one row, so confirm the actual mix in each company's latest quarterly report.
Strong demand, uneven share: reading the earnings numbers
The demand is showing up in filings. In Samsung Electro-Mechanics' Q3 2026 results, released October 28, 2026, package solution revenue reached KRW 939.0 billion, up 58% year on year and 22% from the prior quarter. The company credited higher shipments of server CPU, AI accelerator and networking substrates, and said data center customers are still asking for more supply in Q4.
Yet total company revenue for the quarter was KRW 3.76 trillion, so the package unit was roughly a quarter of sales. The rest came mainly from multilayer ceramic capacitors and camera modules, and the package figure also includes automotive substrates. When a diversified components maker is called a substrate stock, write down the segment number and the company total separately.
The US comparison tells a similar story. TTM Technologies reported Q3 2026 net sales of $1.2 billion, up 60%. Data center and networking was 41% of sales, up from 30% a year earlier, and that end market grew 115%. Book-to-bill was 2.13. On those numbers alone the AI benefit looks clear, but the quarterly filing adds context investors should not skip.
Five metrics to avoid AI PCB stocks traps
Two traps come up again and again. The first is a company with an AI label but little AI revenue. The second is a company with real AI exposure but heavy customer concentration, capex strain or expectations already priced in. These metrics help catch both.
- 1
AI revenue share
Find the server, accelerator and networking share in segment or end-market data. If the company does not disclose it, note that. Development work, sampling and production readiness are not the same as recognized revenue.
- 2
Customer concentration
TTM's 10-Q shows its five largest customers made up 42% of Q3 sales and one customer about 20%. Two customers also accounted for 30% of receivables at quarter end. A design change or inventory adjustment at one buyer can move the whole quarter.
- 3
Capex and ramp timing
Separate the announced investment, the planned completion date and the actual production start. New lines add depreciation and yield costs before they add margin.
- 4
Pricing power and margins
Check whether average selling prices, gross margin and operating margin rise with revenue. TrendForce notes that moving to higher-grade copper foil cuts yield by roughly 50%, shifting bargaining power upstream. If input costs rise faster than prices, revenue growth can come with thinner profits.
- 5
Balance sheet
Watch leverage and acquisition spending. TTM put net leverage at 2.8x pro-forma adjusted EBITDA at the end of September 2026. Debt taken on in a boom becomes a burden if demand slows.
Circuit boards and substrates have a long history of shortage followed by oversupply. Heavy capacity additions can pressure prices a few years later, and new technologies such as glass core substrates could reshape demand for existing products. Strong current results and how much future profit the share price already assumes are separate questions.
An earnings-season checklist
On results day, the direction of the metrics above often matters more than headline growth. Put both board makers and their large customers, such as GPU designers and cloud providers, on an earnings calendar. That makes it easier to see how a customer's capex guidance flows through to suppliers with a lag. If a major buyer signals slower spending, recheck the supplier's next-quarter orders and book-to-bill.

Chatter in stock-focused Telegram channels can show which substrate theme is getting crowded. Mention volume reflects attention, not revenue, so take any trending name back to its filings and run the five checks.
- Position: is it a substrate, a high-layer PCB, a memory module board or a material?
- Exposure: is AI or server revenue disclosed, and have you separated segment and company totals?
- Customers: what share of sales and receivables sits with the top buyers?
- Capacity: when does new capacity actually run, and when does depreciation start?
- Profitability: are prices and margins moving with revenue?
- Finances: how much debt and acquisition spending is on the balance sheet?
If you complete this list and still cannot explain how much a company earns from AI servers, the research is not finished. And if every number looks strong but one or two customers drive the business, their spending plans are effectively part of that company's earnings outlook.
Frequently asked questions
What is the difference between a PCB and an ABF substrate?
Do all PCB makers benefit from AI server demand?
Are big capacity expansions a sign earnings will rise?
Where can I find a company's customer concentration?
Sources and references
- 1TrendForce: Rubin's Cableless Architecture and ASIC High-Layer HDI Designs Push PCBs to the Center of AI Compute Power (Nov 20, 2025)(opens in a new tab)www.trendforce.com
- 2Tom's Hardware: The state of ABF substrates in data center silicon in 2026(opens in a new tab)www.tomshardware.com
- 3Samsung Electro-Mechanics newsroom: Q3 2026 results (Korean)(opens in a new tab)samsungsem.com
- 4TTM Technologies: Third Quarter 2026 Results(opens in a new tab)investors.ttm.com
- 5TTM Technologies Form 10-Q for the quarter ended September 28, 2026(opens in a new tab)investors.ttm.com
Related articles
 Stocks
Nvidia Options Explained: Calls, Puts and Big Stock Moves
Why Nvidia calls and puts can swing far more than the stock itself: intrinsic value, time value and implied volatility explained, plus the training and tax rules Korean residents face before trading US stock options.
 Stocks
Real-Time US Stock Quotes for Free: Delayed vs Live Prices
Free 'real-time' US stock prices usually come from Nasdaq venues plus FINRA-reported trades, not the whole market. Learn how to spot delayed quotes, read a site's delay table, and decide when paid full-market data is worth it.
 Stocks
Why the Anthropic IPO Didn't Stop the AI Stock Selloff
Anthropic raised $81bn in the largest IPO on record, yet the Nasdaq wiped out its 2026 gains the next day. Here is how a blockbuster listing and an AI selloff can happen at once.