Contents8 sections
- What a low volatility market looks like in the 2026 data
- How to read a low VIX without over-reading it
- Why stock market volatility can jump when a quiet market ends
- Signals to pair with the VIX before calling a market crash warning
- A practical checklist for a quiet market
- Bottom line: treat calm as a review prompt
- Frequently asked questions
- Sources and references
A long quiet stretch in stocks is not a reliable crash warning on its own. A low volatility market does, however, often mean that risk is being priced cheaply, so the first real shake-out can feel much larger than it is. As of October 2026, public data for the US S&P 500 index and the Cboe Volatility Index (VIX) show that the index's last daily move of 2% or more came on June 5, and that a 53-session run without a 1% drop ended on October 14. This guide explains what a quiet market actually measures, how to translate the VIX into an expected move, and what to review in your own portfolio before the calm breaks.
What a low volatility market looks like in the 2026 data
Volatility comes in two flavors. Realized volatility is calculated from how much prices actually moved in the past. Implied volatility is extracted from option prices and reflects how much traders expect prices to move. The VIX is an implied measure. When both are low at the same time, the market is effectively saying that the recent past was calm and that it expects the near future to be calm too.
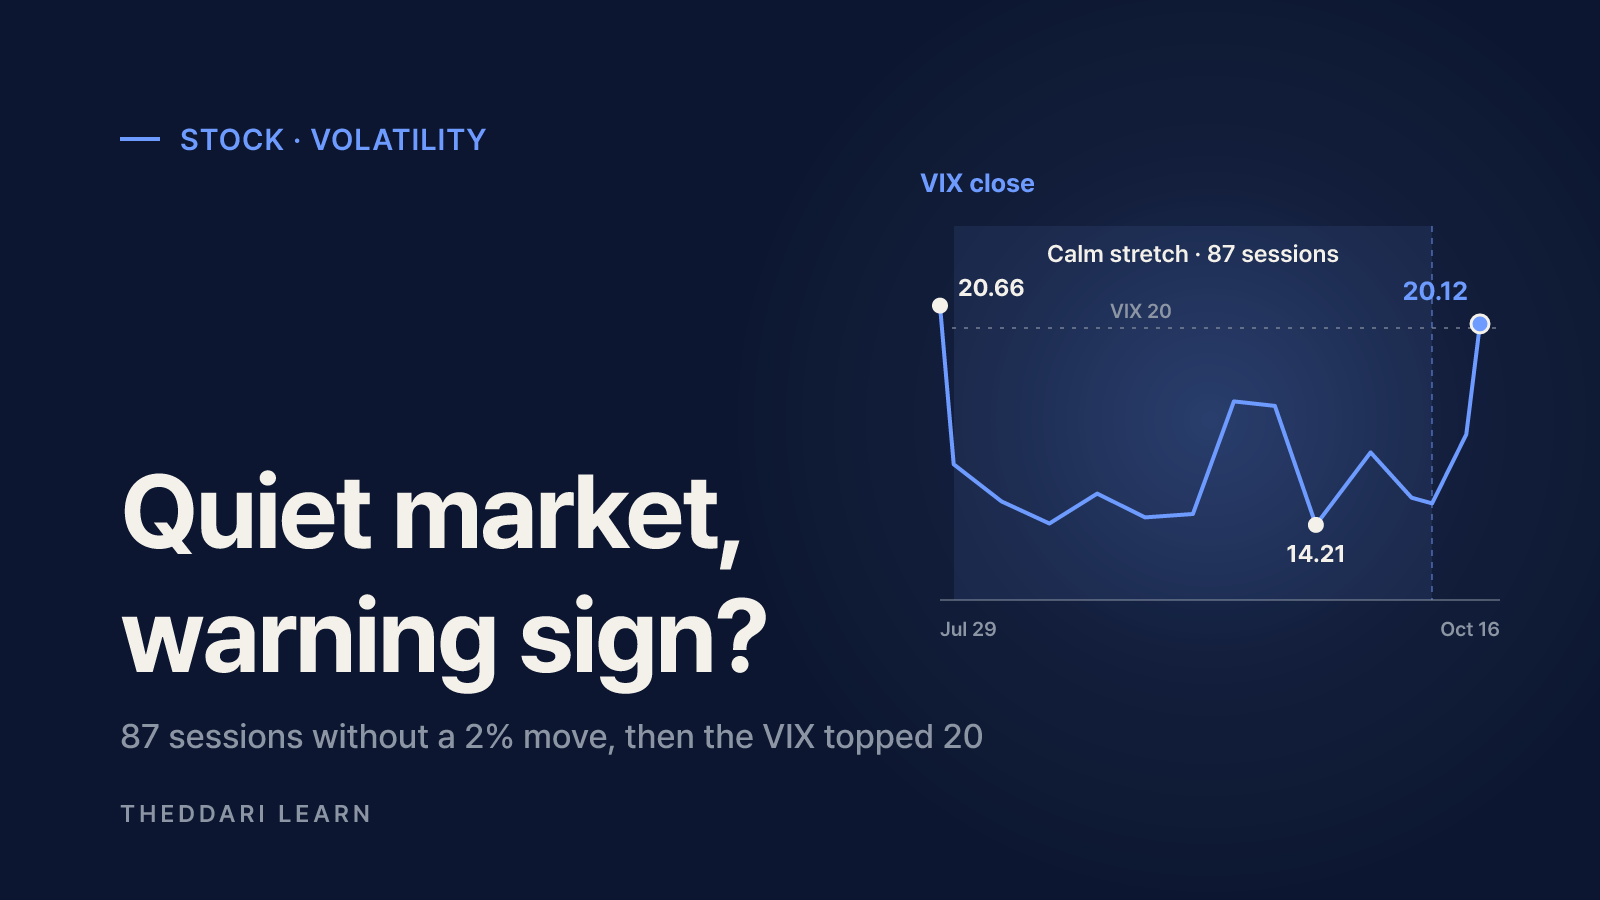
To check the viral "87 days without a 2% move" claim, this guide calculated daily returns from the St. Louis Fed's FRED S&P 500 series using close divided by the previous valid close, minus one, skipping market holidays. The figure holds on a close-to-close basis when counted through October 9. Intraday ranges or a different index would give a different count, which is worth remembering whenever a streak statistic goes viral.
Last move of ±2% or more
- Window
- June 5 close 7,383.74 (prior 7,584.31)
- Result
- −2.64%
Sessions with moves under ±2%
- Window
- June 8 to October 9
- Result
- 87
Sessions with moves under ±2%
- Window
- June 8 to October 15
- Result
- 91
Sessions without a 1% decline
- Window
- July 30 to October 13
- Result
- 53
Streak-ending session
- Window
- October 14 close 7,718.94
- Result
- −1.11%
Largest gain inside the calm
- Window
- August 4
- Result
- +1.79%
The quiet period was not a flat market. The October 6 close of 7,818.93 was the highest in the window checked, so this stretch looked more like a slow grind higher with small daily swings. The October 16 close had not yet appeared in the FRED series at the time of checking, so it is excluded from these counts.
How to read a low VIX without over-reading it
According to Cboe, the VIX is a measure of market expectations of near-term volatility conveyed by S&P 500 index option prices. It is nicknamed the fear gauge, but it is not a probability of decline. Option prices capture potential moves in both directions, so a high VIX means large moves are expected, not that a drop is certain. Cboe also notes that the VIX has historically had a strong inverse relationship with the S&P 500. That describes how volatility expectations tend to jump during selloffs; it does not mean the VIX reliably rises before them.
Turn the VIX into an expected move
The VIX is quoted as an annualized percentage. A common approximation divides it by √12 (about 3.46) for a one-month move and by √252 (about 15.87) for a one-day move. These are one-standard-deviation ranges that assume a normal distribution, and real crashes routinely exceed them. Still, the conversion turns an abstract index level into something you can compare with your account balance.
15
- One-month 1-sigma (VIX ÷ √12)
- about 4.3%
- One-day 1-sigma (VIX ÷ √252)
- about 0.9%
20
- One-month 1-sigma (VIX ÷ √12)
- about 5.8%
- One-day 1-sigma (VIX ÷ √252)
- about 1.3%
30
- One-month 1-sigma (VIX ÷ √12)
- about 8.7%
- One-day 1-sigma (VIX ÷ √252)
- about 1.9%
What the VIX did in 2026
In FRED's VIX daily closes, the index closed at 20.66 on July 29, the day the S&P 500 fell 1.52%, and then spent most of the following weeks between 14 and 17. Its lowest close in that window was 14.21 on September 22. When the calm streak ended on October 14 it rose to 16.87, and Cboe's quote page showed 20.12 on October 16, up 3.66 points or 22.24% in a day. The same page listed a 52-week range of 13.38 to 35.30.
July 29
- VIX close
- 20.66
- Context
- S&P 500 −1.52%
September 22
- VIX close
- 14.21
- Context
- Lowest close in window
October 9
- VIX close
- 14.84
- Context
- 87th session without a 2% move
October 14
- VIX close
- 16.87
- Context
- 53-session no-1%-drop run ends
October 16
- VIX close
- 20.12
- Context
- Per Cboe, +22.24% on the day
Cboe describes volatility as mean-reverting, meaning it tends to drift back toward a long-term average, and notes that implied volatility has tended to trade at a premium to the volatility that is later realized. Low readings rarely last forever, but the VIX level alone cannot tell you when it will rise or by how much.
Why stock market volatility can jump when a quiet market ends
Volatility clusters: big moves tend to follow big moves, and small moves follow small ones. The longer a calm stretch lasts, the more investors anchor on small daily swings as normal, so the first sizable decline lands harder psychologically. Strategies that target a fixed level of volatility also, by design, add equity exposure when volatility is low and cut it when volatility rises. When that kind of mechanical selling overlaps with discretionary selling, moves after a quiet market can be amplified.
It also pays to look beneath the index. Cboe's October 12 Macro Volatility Digest reported that the VIX fell 0.5 points on the week to 14.8 while one-month implied correlation (COR1M) dropped to 6.93%, around the 10th percentile, and stock dispersion rose. Skew, a gauge of demand for downside protection, steepened as well. When individual stocks move in opposite directions, their moves cancel and the index looks calm even as single-stock risk grows. The same report noted the 10-year Treasury yield hit a 24-year high of 5.35% that week before retreating, and the MOVE index of bond volatility stood at 98, in its 94th percentile. Equity volatility was low; rate volatility was not.
The other side of the argument matters too. Quiet markets can persist for many months, and their end does not automatically start a bear market. On October 15, the day after the streak broke, the S&P 500 rose 0.33%. Using low volatility as a sell signal can mean sitting out long rising stretches. A more useful reading is that a quiet market is a reminder to check whether you could live with bigger swings, not a timer counting down to a crash.
Signals to pair with the VIX before calling a market crash warning
No single gauge settles the question. Looking at several measures from different angles reduces the risk of reading too much into one number.
VIX level and speed of change
- What to check
- Position in recent range; multi-day spikes
- Limitation
- Does not forecast direction
VIX versus realized volatility
- What to check
- How far expectations sit above actual moves
- Limitation
- A modest premium is normal
Implied correlation (COR1M)
- What to check
- Whether stocks cancel each other out
- Limitation
- Low correlation is not danger on its own
Skew
- What to check
- Rising demand for downside puts
- Limitation
- Hedging demand, not a confirmed drop
Bond volatility (MOVE)
- What to check
- Stress building outside equities
- Limitation
- May not spill into stocks
Frequency of 1% and 2% days
- What to check
- Whether large sessions are becoming common
- Limitation
- Match the method: close or intraday
A practical checklist for a quiet market
- 1
Put a number on the drawdown you can absorb
Translate the expected move into dollars. At a VIX of 20, a one-month one-sigma move is about 5.8% of an index-like portfolio. Because real selloffs can be two or three times larger, confirm that such a drop would not force you to sell to cover living costs or debt payments.
- 2
Check concentration
Look at how much of your portfolio sits in a handful of names or in one theme such as semiconductors and AI. When index correlation is low, your holdings can move far more than the index.
- 3
Review leverage, margin and options
Rising volatility can increase margin requirements and bring positions closer to forced liquidation. Leveraged and inverse ETFs reset daily, so returns over choppy weeks can differ from a simple multiple of the index.
- 4
Map the calendar
Note scheduled catalysts such as central bank decisions, inflation releases and megacap earnings. A calendar does not predict direction, but it helps you avoid rushed orders on high-impact days.
- 5
Understand any volatility product before using it
VIX futures and products built on them follow the futures curve, not the spot index, and can lose value during long calm periods. Read the product documents on the underlying exposure and costs first.
You can scan upcoming macro releases on the theddari economic calendar and check report dates for large companies on the earnings calendar. Times are worth converting to your own time zone and confirming with the official publisher, since schedules can change.

For a quick read on what stock-focused Telegram channels are discussing, the stock Telegram trends page collects that chatter in one place. Frequent mentions measure attention, not evidence, so verify any figures against primary data.
Bottom line: treat calm as a review prompt
As of October 2026, the S&P 500 spent close to four months without a 2% daily move, then posted its first 1% decline in 53 sessions on October 14 while the VIX climbed above 20 by October 16. That sequence is not enough to forecast a crash, but low implied correlation and elevated bond volatility show that the calm surface was hiding real risk. The useful response to a low volatility market is not trying to time the turn; it is making sure your portfolio can handle larger swings when they arrive. Recording the index, the calculation method and the data date behind any statistic will also help you check the next viral number quickly.