Contents7 sections
Learning how to pick dividend stocks starts with one shift in thinking: the goal is not the highest yield, but a dividend the business can keep paying. A practical sequence works for most individual stocks. First, find out why the yield is high. Second, read the payout ratio. Third, test whether free cash flow actually covers the dividend. Fourth, judge dividend growth against earnings growth. This guide reflects sources checked as of October 2026, focuses mainly on U.S.-listed companies and the SEC's 10-K, and does not recommend any particular stock or fund.
Why a high dividend yield can be a trap
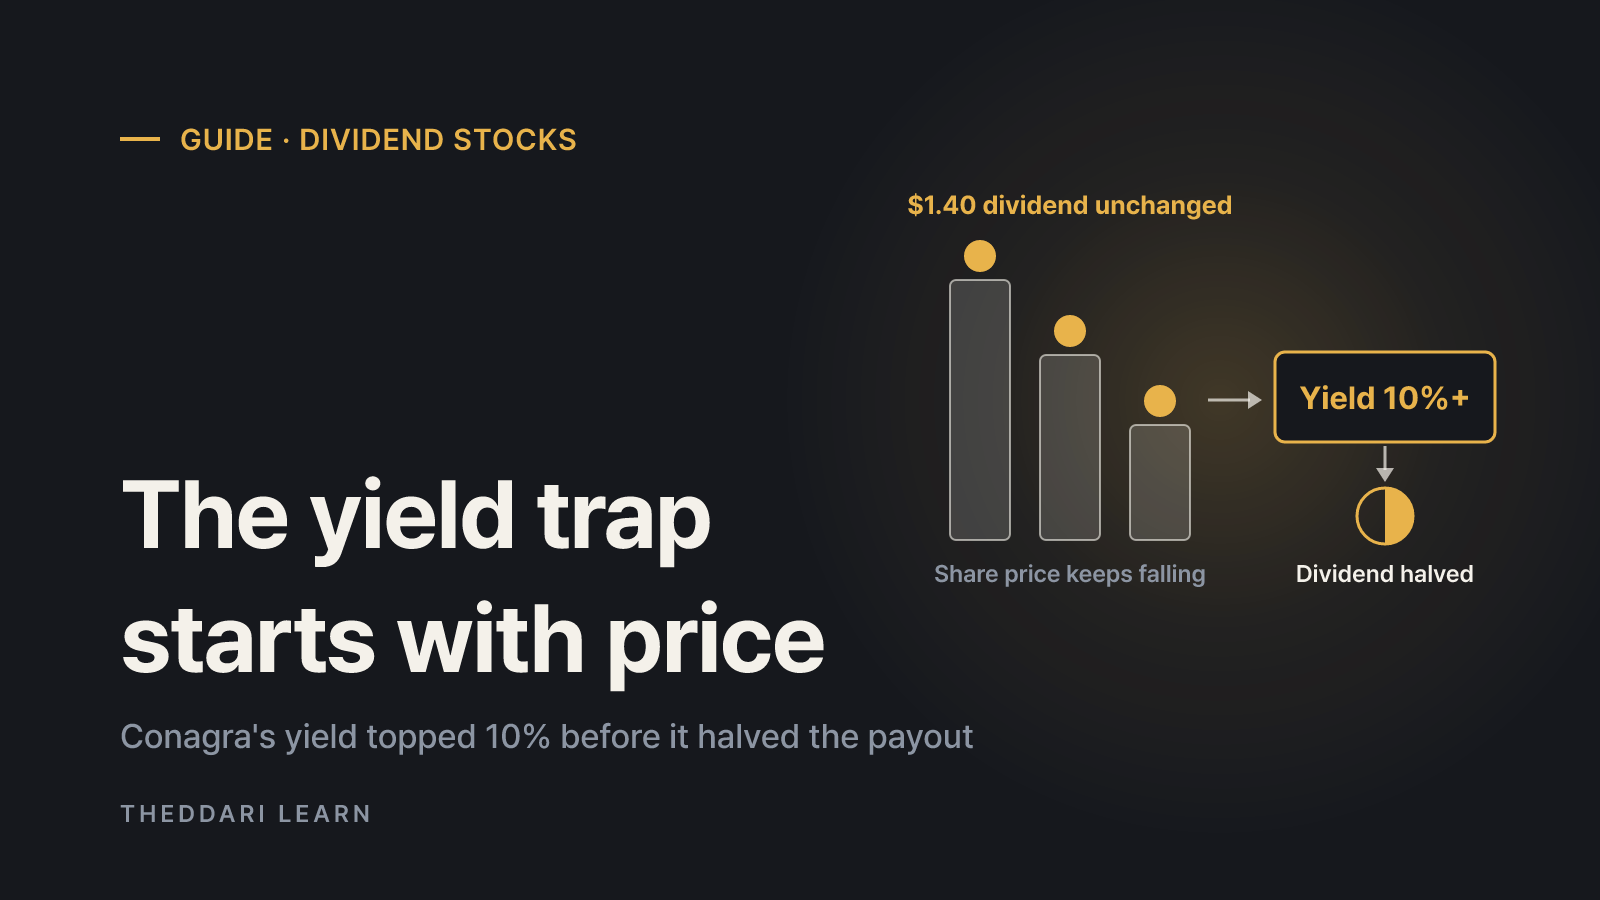
Dividend yield is the annual dividend per share divided by the current share price. Because price sits in the denominator, the yield climbs whenever the stock falls, even if the company has not raised its payout by a cent. That is why many of the biggest numbers on a screener reflect worry about the business rather than generosity. When investors buy for the yield and then suffer both a dividend cut and a further price drop, the stock is usually called a dividend yield trap.
A recent example shows the pattern. According to Morningstar's August 12, 2026 analysis, packaged-food maker Conagra Brands had a trailing 12-month yield above 10% at the end of June 2026. Over the three years through June, its stock fell by more than half while the Morningstar US Total Market Index rose 75%. Its $1.40 annual dividend was being divided by an ever-shrinking share price. In mid-July 2026, Conagra told shareholders it would cut its quarterly payout in half.
When a dividend is cut, investors typically lose both income and principal. Morningstar notes that the share prices of recent dividend cutters generally fell on the news. Read an unusually high yield as a prompt to investigate, not as a reason to buy.
Separate the three reasons a yield rises
The dividend increased
- What it may mean
- The company is distributing more cash
- What to check next
- Whether earnings and cash flow support the higher payout
The share price fell sharply
- What it may mean
- The market may doubt earnings or the dividend
- What to check next
- Latest earnings, debt maturities, risk factors
A special dividend was included
- What it may mean
- A one-off payment inflates trailing yield
- What to check next
- The regular dividend on its own
Also check which dividend the yield uses. A trailing yield is based on payments already made, so a screener can keep showing an old, attractive figure for months after a company has cut or suspended its dividend. A forward yield uses the currently declared rate, which is usually the more relevant number once a change has been announced.
How to read the payout ratio
The payout ratio is the share of earnings paid out as dividends: dividends per share divided by earnings per share, or total dividends divided by net income. If a company earns $4.00 per share and pays $1.60, its payout ratio is 40%, and the other 60% stays in the business for investment, debt reduction or buybacks. That retained portion is the cushion. A firm paying out 40% can absorb a meaningful earnings decline; a firm paying out 95% has almost no room before the dividend exceeds profits.
Above 100%, the company paid out more than it earned during the period, so the gap had to come from cash reserves, borrowing or asset sales. Morningstar says its dividend stock indexes screen out companies with payout ratios above 100%, and it treats negative ratios caused by losses as a red flag too. One caution: a single large write-down or legal charge can spike the ratio for one year. Look at three to five years and read the filing's explanation before drawing conclusions.
- Compare within an industry. Utilities, telecoms and consumer staples tend to run higher payout ratios than fast-growing companies.
- Cyclical businesses can look safe at a peak and become stretched quickly in a downturn.
- REITs and similar pass-through structures are designed to distribute most income, so an earnings-based ratio can mislead; use the cash-based measure the industry reports.
- Heavy buyback programs mean a low dividend payout ratio may understate total cash returned to shareholders.
Check free cash flow coverage and debt
Net income includes non-cash items such as depreciation and fair-value changes, but dividends are paid in cash. A common test is free cash flow: operating cash flow minus capital expenditures. Compare it with dividends paid, which appear in the financing section of the cash flow statement. Coverage comfortably above 1x suggests room to spare. If dividends have exceeded free cash flow for several years running, find out what filled the gap.
Debt competes for the same cash. Interest and principal repayments come before common shareholders, so a company that borrows to protect its dividend may face harder choices later. The SEC's investor site explains how to read a 10-K: start with the business description and Risk Factors, read management's discussion and analysis (MD&A), then review the audited income statement, balance sheet and statement of cash flows. Follow up with the latest quarterly 10-Q, since conditions can change within a year.
Dividend yield
- Formula
- Annual dividend per share ÷ share price
- Warning sign
- Far above peers or the stock's own history
Payout ratio
- Formula
- Dividends per share ÷ earnings per share
- Warning sign
- Above 100%, negative, or rising because earnings fall
FCF coverage
- Formula
- Free cash flow ÷ dividends paid
- Warning sign
- Below 1x for several years
Dividend growth rate
- Formula
- (Latest dividend ÷ starting dividend)^(1/years) − 1
- Warning sign
- Dividend growing much faster than earnings
How to judge dividend growth and track records
Dividend growth measures how fast the payout per share has risen. A single year can be distorted by a special payment or one large raise, so use a compound annual rate over three or five years. If a dividend went from $1.00 to $1.331 in three years, the annual growth rate is 10%. Put that next to earnings per share growth over the same period. When dividends rise much faster than earnings, the payout ratio keeps climbing, and that pace eventually runs out of room.
A long streak of payments or raises signals that management prioritizes the dividend, but it is not a promise. Morningstar observed that several recent cutters had impressive payment and growth histories when they reduced their dividends. Its own durability screens, which combine the payout ratio, a financial-health gauge called distance to default and economic moat ratings, are described as useful for tilting the odds rather than foolproof. Use the record as a starting point and base the conclusion on current earnings, cash flow and debt.
Investors in other markets can apply the same checks with local filings. Korean-listed companies, for example, include a dividend section in their annual business report covering the dividend policy, three years of payout ratio, yield and dividend per share, and the dividend history; Kim & Chang summarizes a December 2024 revision that also requires disclosure of when the dividend amount and record date are set.
How to pick dividend stocks: a five-step checklist
- 1
Diagnose the yield
Line up one to three years of share price and dividend per share. Decide whether a higher yield came from a larger dividend or a lower price, and strip out special dividends.
- 2
Read several years of payout ratios
Record three to five years and flag any year above 100%, any loss year or a sharp rise. Check the filing for one-time charges behind outliers.
- 3
Test cash coverage
Copy operating cash flow, capital expenditures and dividends paid from the cash flow statement, then calculate coverage. Note rising debt and near-term maturities.
- 4
Compare dividend and earnings growth
Calculate the annual dividend growth rate and the EPS growth rate over the same period. If the dividend is outrunning earnings, expect raises to slow.
- 5
Track the calendar
Dividend decisions are often announced alongside quarterly results. Note the next report date and recheck the numbers whenever results change.
The theddari earnings calendar helps you see when the next quarterly report is due, which is often when a raise, freeze or cut is announced. Confirm the date with the company's investor relations page, since schedules can move.

To see which dividend names and cut announcements are drawing attention, the theddari Telegram stock trends page shows what market channels are discussing. Popularity is not evidence of a safe dividend, so run any stock that catches your eye through the checklist above using the filings themselves.
In short, picking dividend stocks is less about finding the biggest number and more about filtering for companies that pass four tests in order: a yield with an understood cause, a manageable payout ratio, real free cash flow coverage and dividend growth supported by earnings. Write down the figures and the filing dates you used, so the next earnings report becomes a quick comparison rather than a fresh search.