Contents7 sections
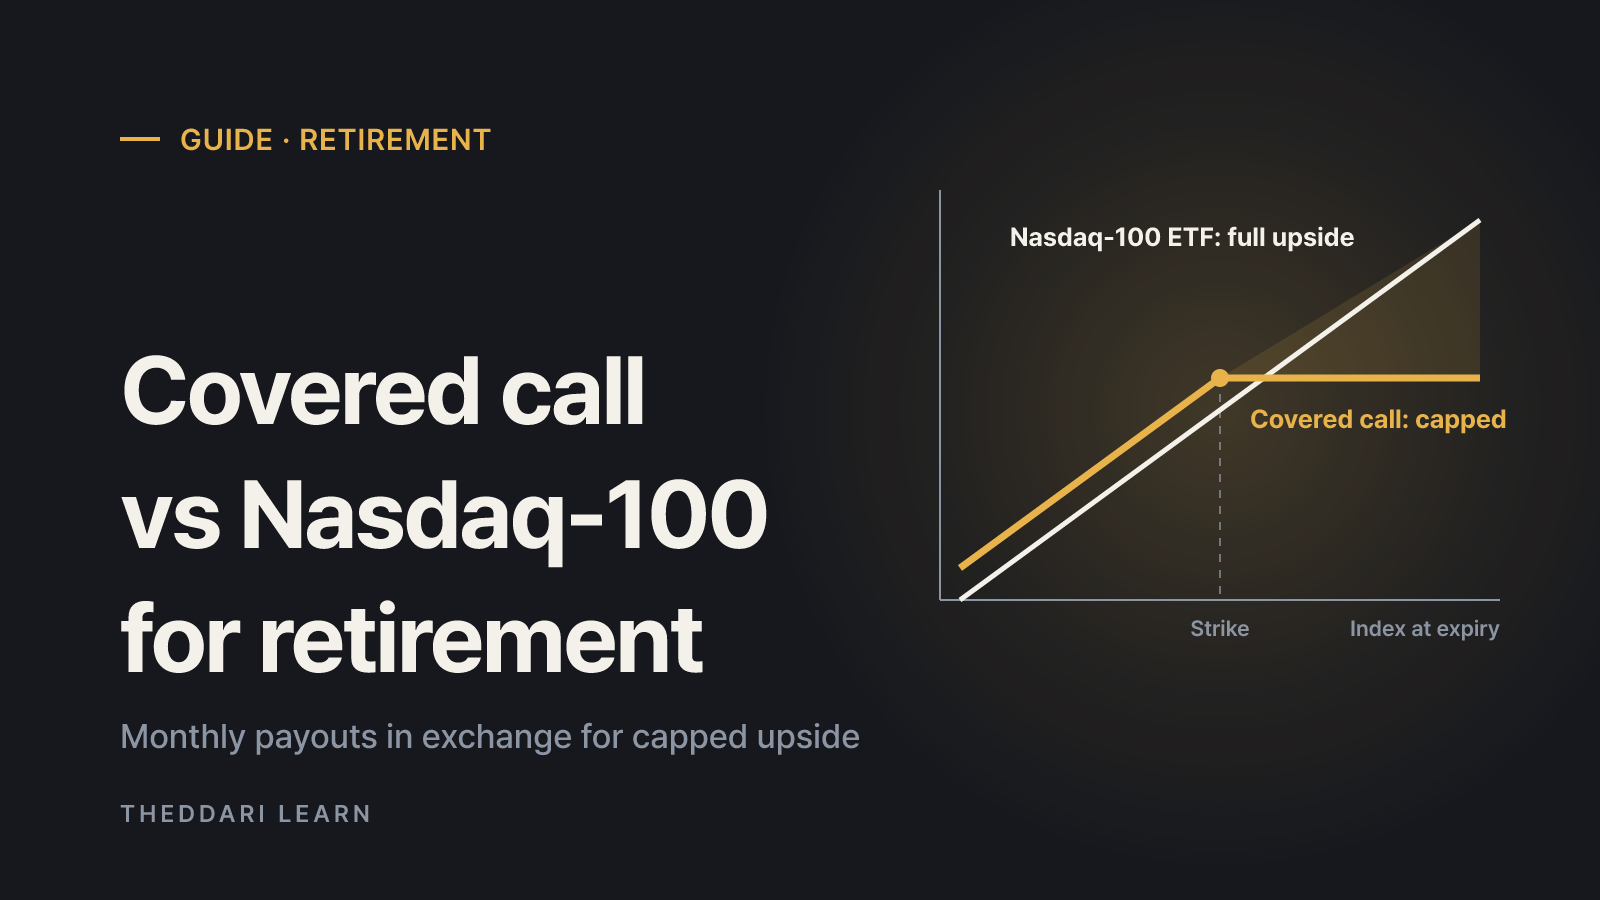
If your goal is a steady monthly paycheck in retirement, a covered call ETF front-loads cash flow, while a Nasdaq-100 ETF grows principal that you trim as needed. Covered call funds look attractive because they pay large, regular distributions, but they hand most of the market's upside to option buyers. A plain Nasdaq-100 fund keeps that upside, yet it leaves you in charge of selling shares, including in bad years. This guide compares both approaches as of October 2026, using fund disclosures and a simple withdrawal example.
How a covered call ETF generates monthly income
A covered call ETF owns stocks or an index and sells call options on the same holdings. The buyer of each call pays a premium, and the fund passes that premium to shareholders as a distribution. The best-known Nasdaq-100 version, Global X's QYLD, buys the Nasdaq-100 stocks and writes calls on the index, tracking the Cboe Nasdaq-100 BuyWrite V2 Index with a 0.60% expense ratio (Global X QYLD). By comparison, Invesco lists a 0.18% total expense ratio for QQQ, which tracks the Nasdaq-100 without options (Invesco QQQ).
The strike price is what matters. QYLD's options table dated October 9, 2026 shows the Nasdaq-100 at 30,883.15 and a short call at a 29,475 strike, with 0.00% upside before cap. Any further rise in the index until expiry goes to the option buyer, not the fund. In exchange, premiums tend to rise when volatility rises.
A simple payoff example
100 to 110 (+10%)
- Nasdaq-100 ETF
- 110
- Covered call (strike 100, premium 2, hypothetical)
- 102 (upside given up, premium kept)
100 to 100 (flat)
- Nasdaq-100 ETF
- 100
- Covered call (strike 100, premium 2, hypothetical)
- 102
100 to 90 (-10%)
- Nasdaq-100 ETF
- 90
- Covered call (strike 100, premium 2, hypothetical)
- 92 (cushioned only by the premium)
These numbers are illustrative. Covered calls tend to win in flat or slow markets, fall far behind in strong rallies, and soften losses only slightly in declines. iShares calls capped upside participation the most important trade-off and says premiums may offset only part of the downside in broad sell-offs (iShares).
Covered call vs growth: payouts versus total return
A high yield is not the same as a high return. As of October 12, 2026, Global X reported a trailing 12-month distribution of 12.02% and a distribution rate of 11.14% for QYLD, and it states that distributions are estimated to include return of capital. On the same page, QYLD's annualized NAV returns as of September 30, 2026 were 22.94% over one year, 9.33% over five years, 10.03% over ten years and 9.01% since inception.
Return source
- Covered call ETF (QYLD example)
- Option premiums plus dividends
- Nasdaq-100 ETF (QQQ example)
- Price growth plus small dividends
Expense ratio
- Covered call ETF (QYLD example)
- 0.60%
- Nasdaq-100 ETF (QQQ example)
- 0.18%
Bull market
- Covered call ETF (QYLD example)
- Gives up gains above the strike
- Nasdaq-100 ETF (QQQ example)
- Captures full upside
Bear market
- Covered call ETF (QYLD example)
- Small cushion from premium
- Nasdaq-100 ETF (QQQ example)
- Full decline
10-year figure (as disclosed)
- Covered call ETF (QYLD example)
- 10.03% annualized NAV (Sep 30, 2026)
- Nasdaq-100 ETF (QQQ example)
- 22.06% NAV (Jun 30, 2026, per Invesco)
Cash flow
- Covered call ETF (QYLD example)
- Monthly, amount varies
- Nasdaq-100 ETF (QQQ example)
- You sell shares on your schedule
The two performance figures use different end dates, so treat them as directional rather than a precise spread. The direction is consistent with earlier research: in a 2023 interview, Morningstar noted QYLD had trailed QQQ by about 9.5 percentage points a year over ten years, and pointed out that income investors can also own QQQ and sell off what they need.
If you withdraw more each year than the fund earns in total return, the gap comes out of principal. A fund returning 9% a year while paying out 12% will tend to see both its share price and its monthly checks shrink over time.
Retirement income math: a $500,000 example
Popular videos promise lifetime income such as $5,000 a month from $500,000. That is $60,000 a year, or a 12% withdrawal rate. Here is how the two approaches compare before taxes:
- Covered call route: $500,000 at a 12% payout rate produces about $60,000 a year ($5,000 a month), with the share price exposed to erosion if total return falls short of 12%.
- Sell-down route: the same $500,000 in a Nasdaq-100 ETF with a 4% annual withdrawal produces $20,000 a year (about $1,667 a month), while the remaining shares stay fully invested.
- Taxes then change the picture: covered call distributions in a taxable U.S. account are often taxed at ordinary income rates, while shares sold from a long-held index fund may qualify for long-term capital gains treatment, with only the gain portion taxed.
In short, the covered call fund pays you more today and the sell-down approach pays you less today but keeps growth potential. Which fits depends on your time horizon, other income such as Social Security or a pension, and whether you want to leave money behind. The biggest danger for the sell-down approach is a large drop early in retirement, when selling depressed shares locks in losses.
A bucket approach that blends both
- 1
Hold one to two years of spending in cash or short-term bonds
This buffer means you rarely have to sell stocks after a crash.
- 2
Use income assets for part of baseline spending
Covered call, dividend or bond funds can supply monthly cash; size them by total return, not by yield.
- 3
Keep a growth sleeve in an index ETF
Trim a Nasdaq-100 or broad-market fund after strong years to refill the cash bucket.
- 4
Review once a year
Check NAV trends, distribution changes and your tax bracket, then adjust the withdrawal rate.
Taxes and account location
Where you hold a covered call ETF matters as much as which one you pick. Morningstar notes that call-writing gains are typically taxed as ordinary income rather than at potentially lower long-term capital gains rates, which is why many U.S. investors place these funds in IRAs or 401(k)s. Return-of-capital portions are generally not taxed when paid but reduce your cost basis, which raises the gain when you eventually sell. iShares also points out that tax treatment varies by option type, underlying assets and accounting method, so review the fund's tax documents each year.
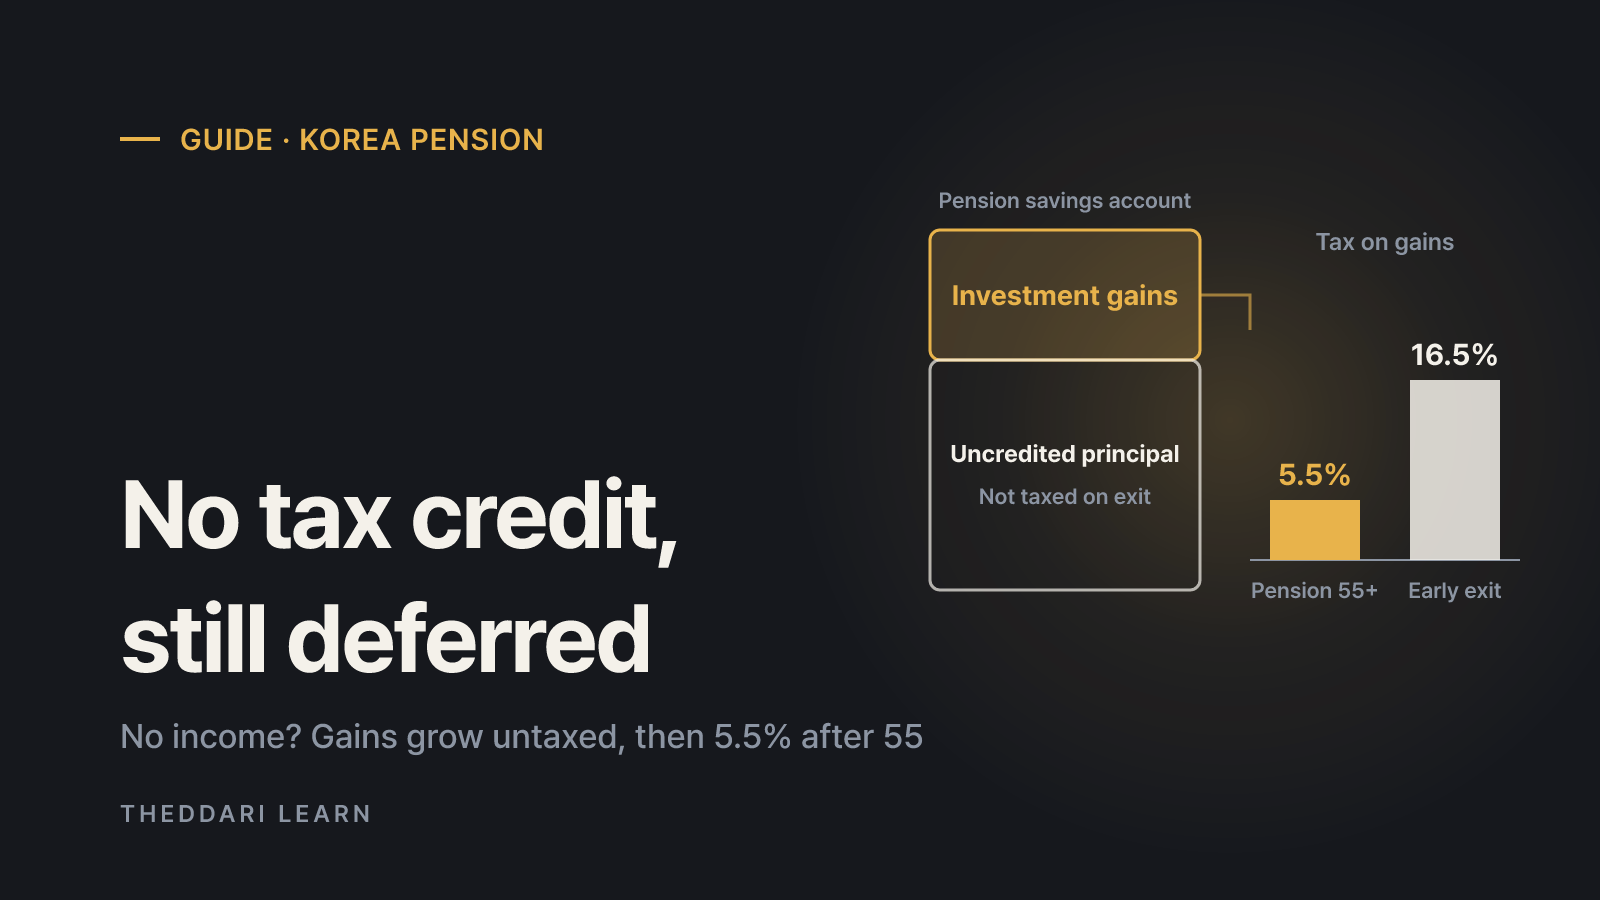
For readers in South Korea, the rules are different. Distributions from Korean-listed covered call ETFs that hold overseas assets are treated as dividend income and withheld at 15.4%, and financial income above 20 million won a year is added to other income for progressive taxation, according to Mirae Asset's pension research center. Korean pension accounts defer that tax until withdrawal.
Which approach fits you
Time horizon
- Covered call ETF may fit
- About 10 years or less
- Nasdaq-100 sell-down may fit
- 20 to 30+ years
Temperament
- Covered call ETF may fit
- You want automatic monthly deposits
- Nasdaq-100 sell-down may fit
- You can follow a selling schedule
Legacy goals
- Covered call ETF may fit
- Leaving principal is not a priority
- Nasdaq-100 sell-down may fit
- You want to preserve or grow principal
Account type
- Covered call ETF may fit
- Tax-deferred account
- Nasdaq-100 sell-down may fit
- Taxable account with long-term gains
Market view
- Covered call ETF may fit
- You expect choppy, volatile markets
- Nasdaq-100 sell-down may fit
- You prioritize long-term upside
Because covered call payouts tend to rise with volatility, it helps to know when market-moving events are scheduled. The economic calendar on theddari lists FOMC meetings and inflation releases. Use it to anticipate volatile weeks, not to predict returns.

To see which income ETFs and Nasdaq-100 stories investors are discussing right now, the stock trend feed collects headlines from public channels. Treat it as context on market chatter, not as a recommendation.
The bottom line: a covered call ETF converts future upside into cash today, which can stabilize spending over a shorter horizon but weakens long-term growth. A Nasdaq-100 ETF keeps growth potential but requires a cash buffer and a disciplined withdrawal rate to survive bad years. Whichever you choose, compare total return, after-tax income and NAV trends rather than the headline yield.