Contents8 sections
- How spot bitcoin ETF flows are counted
- Reading the $1.28 billion outflow week of November 2026
- Why bitcoin ETF outflows do not always mean institutional selling
- How to read ETF flow data step by step
- Do ETF flows predict the bitcoin price?
- A checklist for the next outflow headline
- Frequently asked questions
- Sources and references
Bitcoin ETF outflows mean that, over a given period, more shares of U.S. spot bitcoin funds were redeemed than created. They are a measure of demand for the ETF wrapper, not proof that institutions are abandoning bitcoin and not a reliable forecast of the next price move. This guide uses public data checked as of November 10, 2026, to explain how flow numbers are produced, how to read the daily tables most traders quote, and what the evidence says about flows and price. The week of November 2 to 6, 2026, when the funds lost about $1.28 billion, serves as a worked example.
How spot bitcoin ETF flows are counted

A spot bitcoin ETF is a trust that holds bitcoin directly. When you buy shares through a brokerage account, you usually buy them from another investor on the exchange, and that trade does not change the fund's flow figure. Flows come from authorized participants (APs), broker-dealers that deal with the trust in large blocks called baskets. An AP creates shares by delivering cash or bitcoin, or redeems shares and takes cash or bitcoin out. As ETF.net notes, citing BlackRock's prospectus, IBIT shares are redeemable only in baskets and only by APs.
Net flow for a day is creations minus redemptions. Heavy trading volume with no creations or redemptions shows up as zero. When ETF shares trade below the value of the bitcoin behind them, APs have an incentive to buy shares cheaply and redeem them, which produces an outflow. So the flow number reflects how APs balanced supply and demand for the shares, not a headcount of who is bullish or bearish.
Investor-to-investor trade
- What happens
- Existing shares change hands
- Shows up in flows?
- No
Creation
- What happens
- AP delivers cash or bitcoin, gets new shares
- Shows up in flows?
- Yes, as an inflow
Redemption
- What happens
- AP returns shares, gets cash or bitcoin
- Shows up in flows?
- Yes, as an outflow
In-kind dealing
- What happens
- Bitcoin moves directly; the trust need not trade
- Shows up in flows?
- Yes, but the method is not shown
When the SEC approved spot bitcoin ETFs in January 2024, the funds were limited to cash creations and redemptions. On July 29, 2025, the SEC approved orders permitting in-kind creations and redemptions for bitcoin and ether products. In a cash redemption the trust sells bitcoin; in an in-kind redemption it hands bitcoin to the AP, which decides what to do next. The order allows in-kind dealing without requiring it, and the daily tables do not reveal which method a fund used.
Reading the $1.28 billion outflow week of November 2026
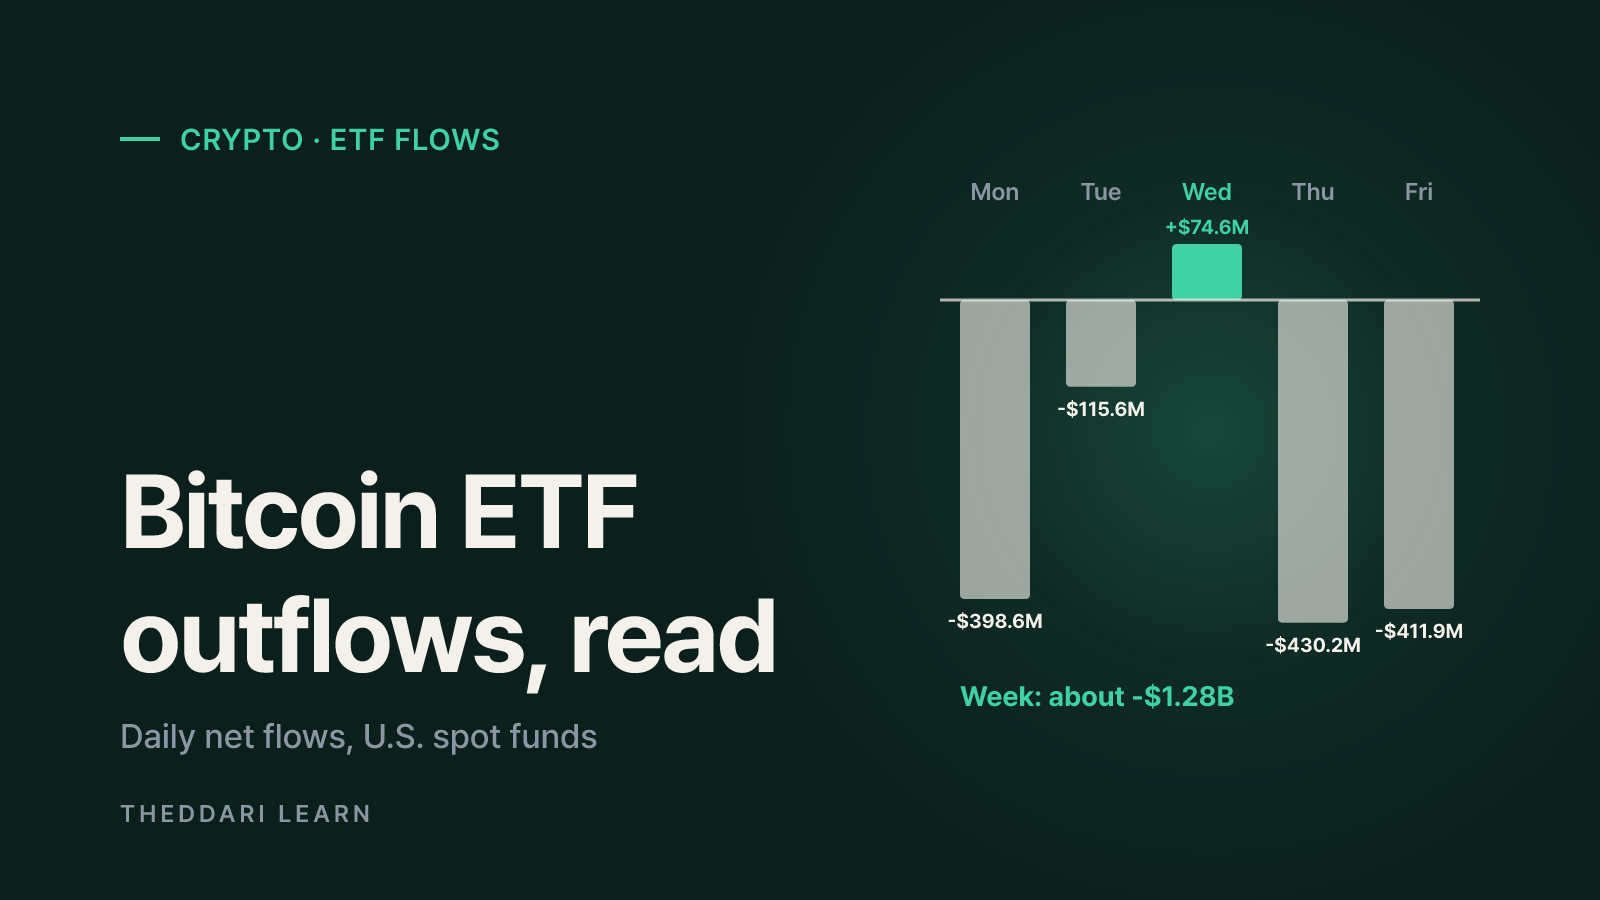
According to The Block's analysis of SoSoValue data, the 12 U.S. spot bitcoin ETFs recorded about $1.28 billion of net outflows from November 2 to 6, 2026. It was the worst week since the week ended June 26 (about $1.79 billion out), the seventh-largest weekly outflow since launch, and the second negative week in a row after roughly $202.6 million left the week before.
Mon, Nov. 2
- Total net flow
- -$398.6 million
- Note
- Mostly IBIT
Tue, Nov. 3
- Total net flow
- -$115.6 million
- Note
- Outflows continue
Wed, Nov. 4
- Total net flow
- +$74.6 million
- Note
- IBIT out, FBTC about +$237 million
Thu, Nov. 5
- Total net flow
- -$430.2 million
- Note
- Largest day; FBTC also out
Fri, Nov. 6
- Total net flow
- -$411.9 million
- Note
- IBIT alone -$403 million
Week
- Total net flow
- About -$1.28 billion
- Note
- Four of five sessions negative
The week flipped the 2026 tally from about $368 million of net inflows to about $914.1 million of net outflows year to date. The funds held about $95.9 billion of bitcoin, roughly 6.3% of bitcoin's market capitalization. The Block tied the outflows to a crypto and equities selloff after the U.S. midterm elections, with bitcoin down 5.6% on Thursday alone. ETF.net put bitcoin about 13.5% lower for the year as of November 7.
Concentration in one fund
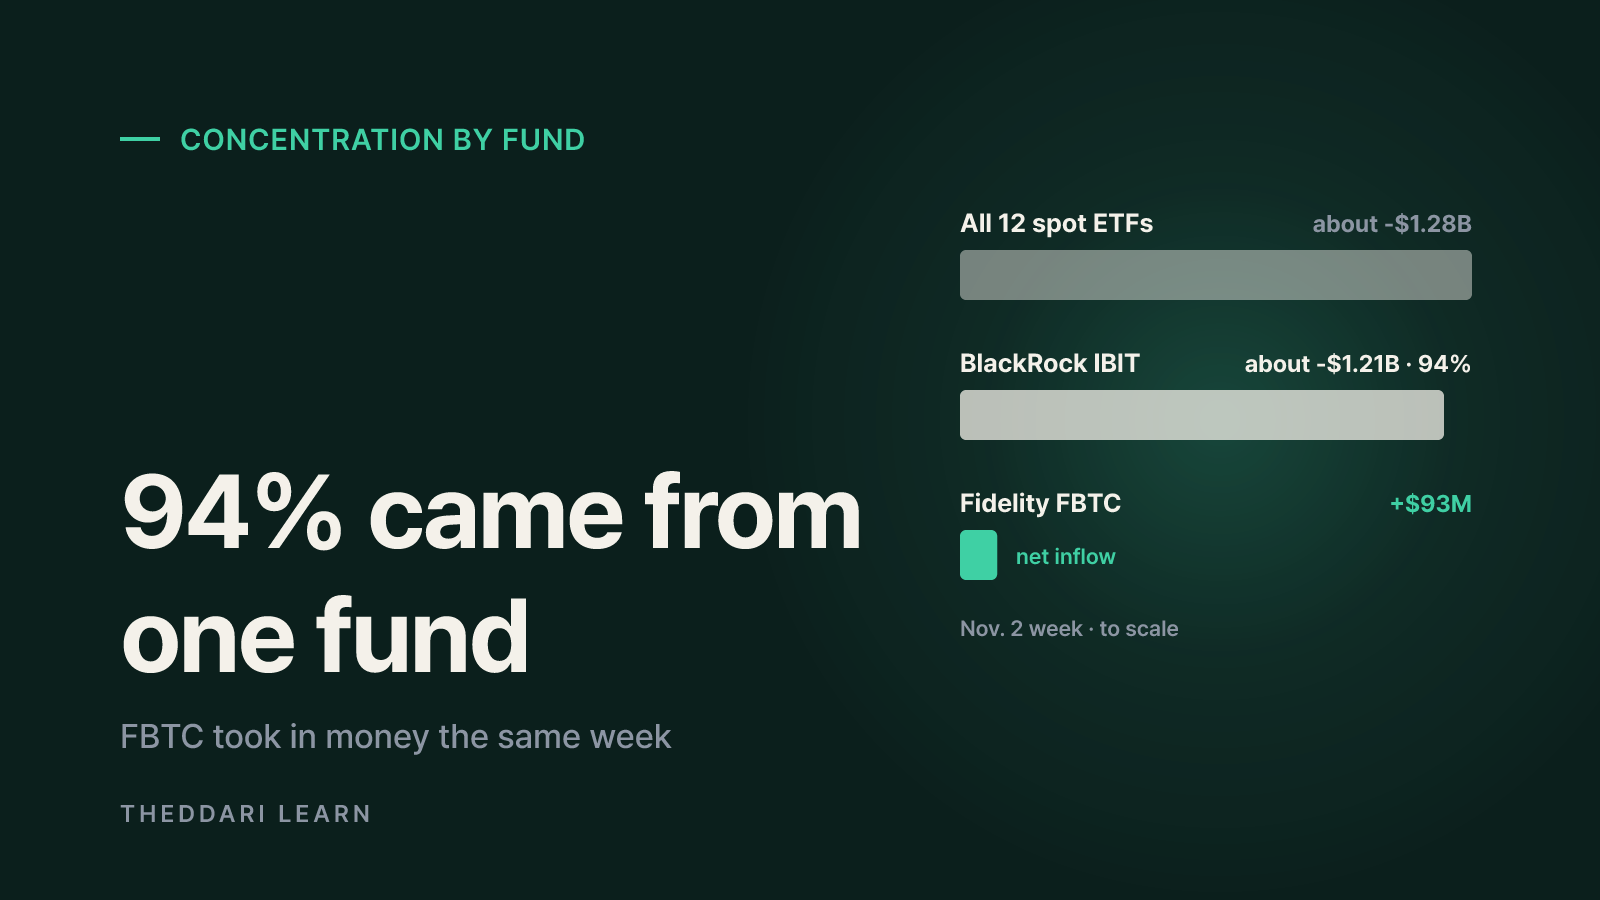
ETF.net calculated that IBIT accounted for about $1.21 billion, or 94%, of the week's outflow, with withdrawals on all five sessions. On Wednesday, when the group as a whole took in money, IBIT still lost about $201 million while Fidelity's FBTC added about $237 million; FBTC ended the week about $93 million positive. Money moving between funds that hold the same asset is not the same as money leaving bitcoin. In proportion, IBIT's outflow was about 2% of its roughly $60.7 billion in net assets, and its shares averaged about $1.77 billion of daily trading over the prior 20 sessions. The Block put IBIT's net assets at $60.3 billion, a reminder that figures vary by source and timestamp.
Why bitcoin ETF outflows do not always mean institutional selling
Headlines often equate outflows with institutions heading for the exit. The flow number alone cannot tell you who sold, why, or how. Before drawing that conclusion, rule out these mechanisms.
- In-kind redemptions: bitcoin may simply move to the AP rather than being sold by the trust.
- The reverse also applies: moving bitcoin you already own into an ETF in kind counts as an inflow without any new market buying.
- Basis trade unwinds: hedge funds that buy ETF shares and short CME bitcoin futures are harvesting the price gap, not betting on direction. Closing that trade creates outflows that say little about their view on bitcoin.
- Fund switching: moves between funds with different fees appear as an outflow in one and an inflow in another. ETF.net lists GBTC at 1.50%, IBIT and FBTC at 0.25%, and Grayscale's mini trust at 0.15%.
- Portfolio risk cuts: managers who hold bitcoin ETFs alongside stocks may trim both when reducing overall risk, which is a portfolio decision rather than a verdict on bitcoin alone.
DWF Labs research estimated from weekly CFTC data that leveraged funds added about 0.21 BTC of CME shorts for every 1 BTC of ETF inflow, implying about a fifth of flows were hedged this way. In the January to April 2025 sell-off, ETF outflows of 41,500 BTC roughly matched 44,600 BTC of closed CME shorts. Leveraged funds' net short has since shrunk from about 116,000 BTC in December 2024 to about 29,000 BTC, so current flows likely reflect directional demand more than in 2024. The authors call these figures an upper bound.
How to read ETF flow data step by step
The most common free source is the Farside Investors bitcoin ETF flow table, which starts on January 11, 2024, lists each fund (IBIT, FBTC, BITB, ARKB, GBTC and others) in its own column, and ends with a Total column. Values are in millions of U.S. dollars and outflows appear in parentheses. SoSoValue publishes a similar series.
- 1
Start with the Total column
Look at direction and persistence. Four outflow days out of five tells a different story from one large day followed by a quick reversal.
- 2
Check which funds moved
See whether the move is concentrated in one or two funds or spread across many. Offsetting inflows elsewhere point to switching.
- 3
Convert dollars into ratios
Divide the outflow by the fund's net assets or average daily trading value. A record in dollars can be ordinary as a percentage.
- 4
Align dates and time zones
Flows are struck at the 4 p.m. New York close, while bitcoin trades around the clock. Monday's flows may react to a weekend move, and small funds can report late.
- 5
Add futures context
If CME open interest and hedge fund shorts fall alongside ETF outflows, a basis unwind is more likely. If they do not, directional selling deserves more weight.
Flow tables cover only U.S.-listed products. To see demand outside them, the theddari Kimchi premium page compares Korean exchange prices with global prices, and the funding arbitrage page shows funding rate gaps in perpetual futures.

Do ETF flows predict the bitcoin price?
DWF Labs compared Farside flows with Coinbase prices over 694 trading days, from January 11, 2024, to October 16, 2026. Flows correlated 0.41 with the same day's price change and 0.54 with the prior five days, but only 0.09 with the next day and 0.03 with the next five days. ETFs saw net outflows in seven of eight sell-offs of 15% or more, and selling tended to accelerate after bitcoin fell about 7% from its 20-day high. IBIT's flows carried no more predictive signal than the rest of the group.
The practical takeaway is that big outflows usually confirm a decline already under way rather than warn of the next one, and big inflows have not reliably preceded rallies either. The study's own caveats matter: a market maker published it, it rests on a small sample of sell-offs, correlation does not establish cause, and daily data hides intraday timing.
A checklist for the next outflow headline
- Identify the source and date, and whether the figure is daily, weekly or monthly.
- Note how long the streak has run and the year-to-date direction.
- Check concentration by fund and any offsetting inflows.
- Express the outflow as a share of net assets and daily trading value.
- Look at CME futures positioning, funding rates and cross-exchange price gaps.
- Line up macro events such as elections, rate decisions and data releases.
The theddari economic calendar lists scheduled releases with their times; it tells you when news lands, not which way prices will go. Used together with flow tables, it helps separate what is confirmed from what is still a guess, so an outflow headline becomes one data point rather than the whole story.