Contents6 sections
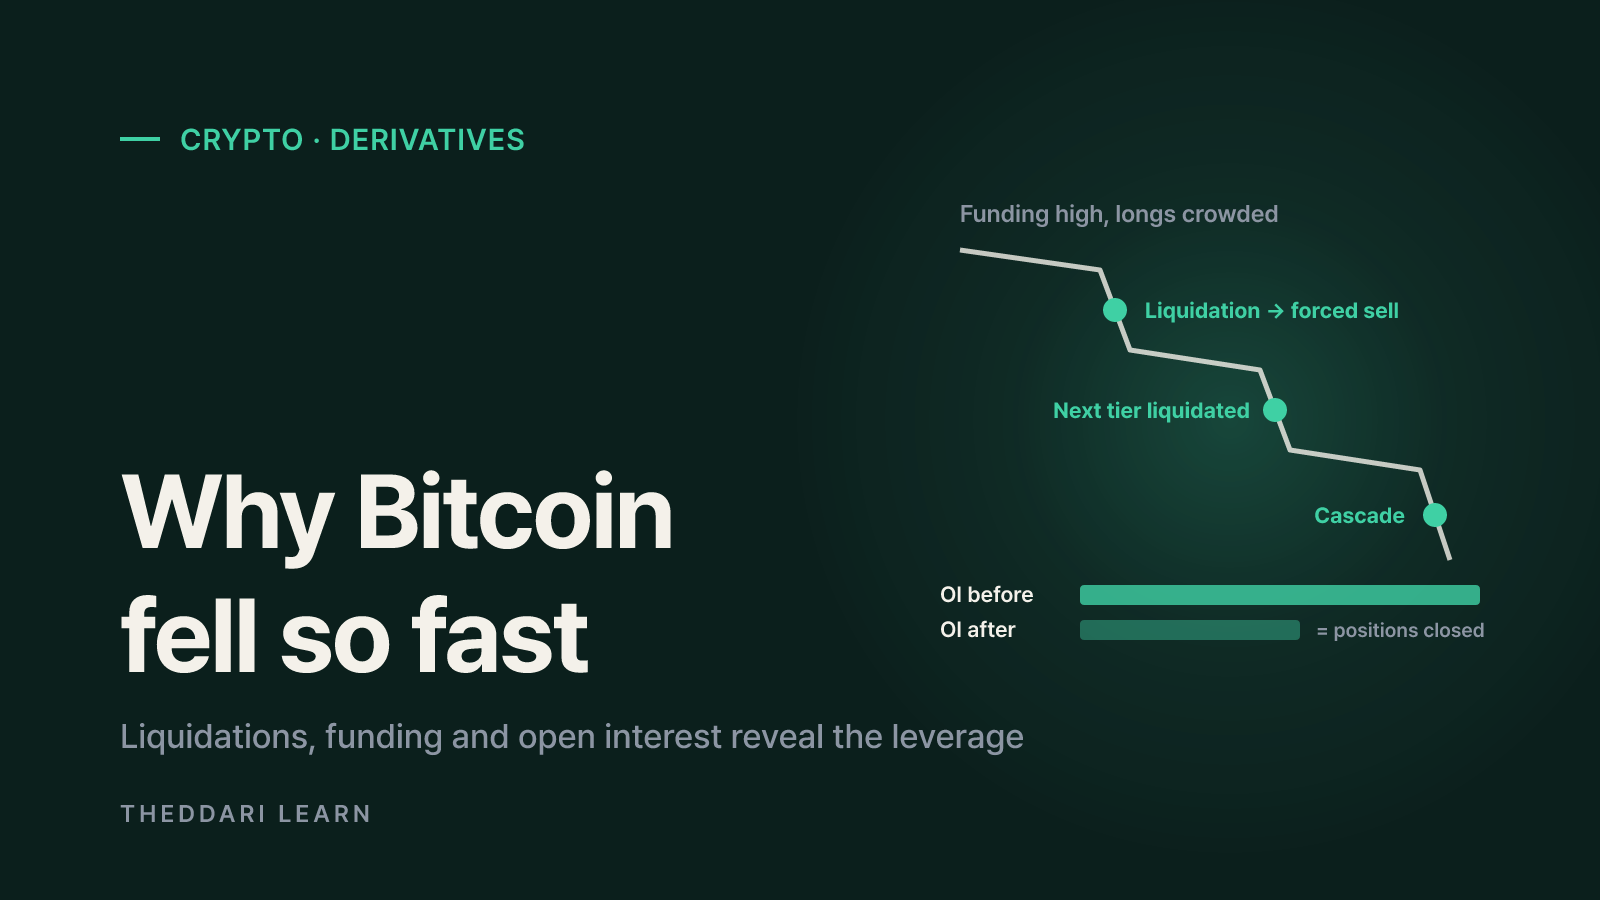
If you want to understand a Bitcoin crash yourself instead of relying on headlines, start with three derivatives metrics: liquidations, funding rates and open interest (OI). Compare them just before the drop and just after it. If funding was elevated and open interest had been building, and the sell-off came with a wave of long liquidations and a sharp fall in open interest, leverage being flushed out most likely made the move bigger. What this data cannot tell you is what started the selling. This guide uses exchange and CME documentation reviewed as of November 2026 to explain each metric, the order to check them in and the limits of the analysis. It does not attribute any specific day's decline to a single cause.
What liquidations, funding and open interest actually measure
All three metrics come from the futures market, mostly from perpetual swaps, the no-expiry contracts that dominate crypto derivatives trading. When a lot of leveraged positions sit on one side of the market, a modest decline can snowball. So after a sharp drop the useful questions are: how much leverage was in the market, which direction was it leaning, and how much of it was forcibly closed? Each metric answers one of those.
Open interest
- Question it answers
- How much leverage had built up?
- What to check in a crash
- Rise before the drop, size of the decline during it
Funding rate
- Question it answers
- Which side was crowded?
- What to check in a crash
- Elevated positive funding beforehand, flip to negative after
Liquidations
- Question it answers
- How much was force-closed?
- What to check in a crash
- Long vs short split and when they clustered
Open interest: contracts still open
CME Group defines open interest as the total number of futures contracts held by market participants, calculated by adding contracts from newly opened trades and subtracting them when trades are closed. In its example, three traders open one long, six longs and three shorts, taking open interest to 10; it falls as each one exits. Volume counts every contract traded, while open interest only counts what remains open. CME notes that analysts often treat rising open interest as confirmation of a trend and falling open interest as a sign the trend is losing strength. One practical difference: CME publishes open interest at the end of each trading day, while crypto exchanges typically show it close to real time.
Funding rate: the payment that tethers perps to spot
Because perpetual swaps never expire, exchanges use periodic funding payments to keep the contract price near the spot index. According to OKX's funding documentation, when funding is positive, longs pay shorts; when it is negative, shorts pay longs, and the exchange does not take a cut. Funding settles every 8 hours by default (00:00, 08:00 and 16:00 UTC), with some contracts on 1-, 2- or 4-hour cycles. The rate is built from a weighted average premium index, which measures how far the contract's impact bid and ask sit from the index price, plus a 0.01% interest component, with the gap between them clamped to plus or minus 0.05% before caps and floors apply. In plain terms, the richer perps trade relative to spot, the higher funding goes. OKX also shortens the settlement interval automatically when funding hits its cap or floor.
OKX gives a simple sizing example: a long of 10 contracts at 0.01 BTC each with a mark price of 60,000 USDT is worth 6,000 USDT, so a 0.1% funding rate costs 6 USDT at settlement. That charge repeats every interval, and OKX notes that funding deductions reduce account equity and can bring a position closer to liquidation.
Liquidations: forced closing when margin runs out
OKX's liquidation guide says positions are reduced or liquidated when the maintenance margin ratio falls to 100% or below. The trigger uses the mark price, which blends prices from multiple venues, rather than the last traded price, so a brief spike on one exchange should not liquidate positions by itself. A liquidated trader loses the margin tied to that position and may also pay a liquidation fee and accrued funding. If forced orders cannot be absorbed and the exchange's risk reserve drops sharply, OKX applies auto-deleveraging (ADL), reducing profitable opposing positions at the mark price. OKX currently describes that threshold as a 30% decline in the reserve from its peak within 8 hours and says it can change.

How to check a Bitcoin crash with derivatives data: five steps
Explanations flood social media within minutes of a sharp move. Working through a fixed sequence helps you separate what the data shows from what people are guessing. Write down the values and timestamps you find at each step so you can compare them with later commentary.
- 1
Pin the time window in UTC
Mark when the steep decline started and ended. Note whether it overlapped a funding settlement, a scheduled US economic release or a major headline. Exchange data is usually stamped in UTC, so convert your local time before comparing.
- 2
Check funding and open interest before the drop
Look at several funding intervals leading into the move. Was funding persistently positive and elevated? Was open interest climbing faster than price? Both together suggest leveraged longs were crowded. Compare major exchanges rather than relying on one venue.
- 3
Measure liquidations during the drop
Split long liquidations from short liquidations and see when they clustered. A tight burst of long liquidations inside the steepest candle points to a cascade. If liquidations were modest, spot selling or another factor probably mattered more.
- 4
Calculate the open interest decline afterward
Work out the percentage fall in open interest from its pre-drop high. A large decline alongside price suggests position closing drove much of the move. Rising open interest during the drop instead suggests fresh shorts were opening.
- 5
Look for the trigger elsewhere
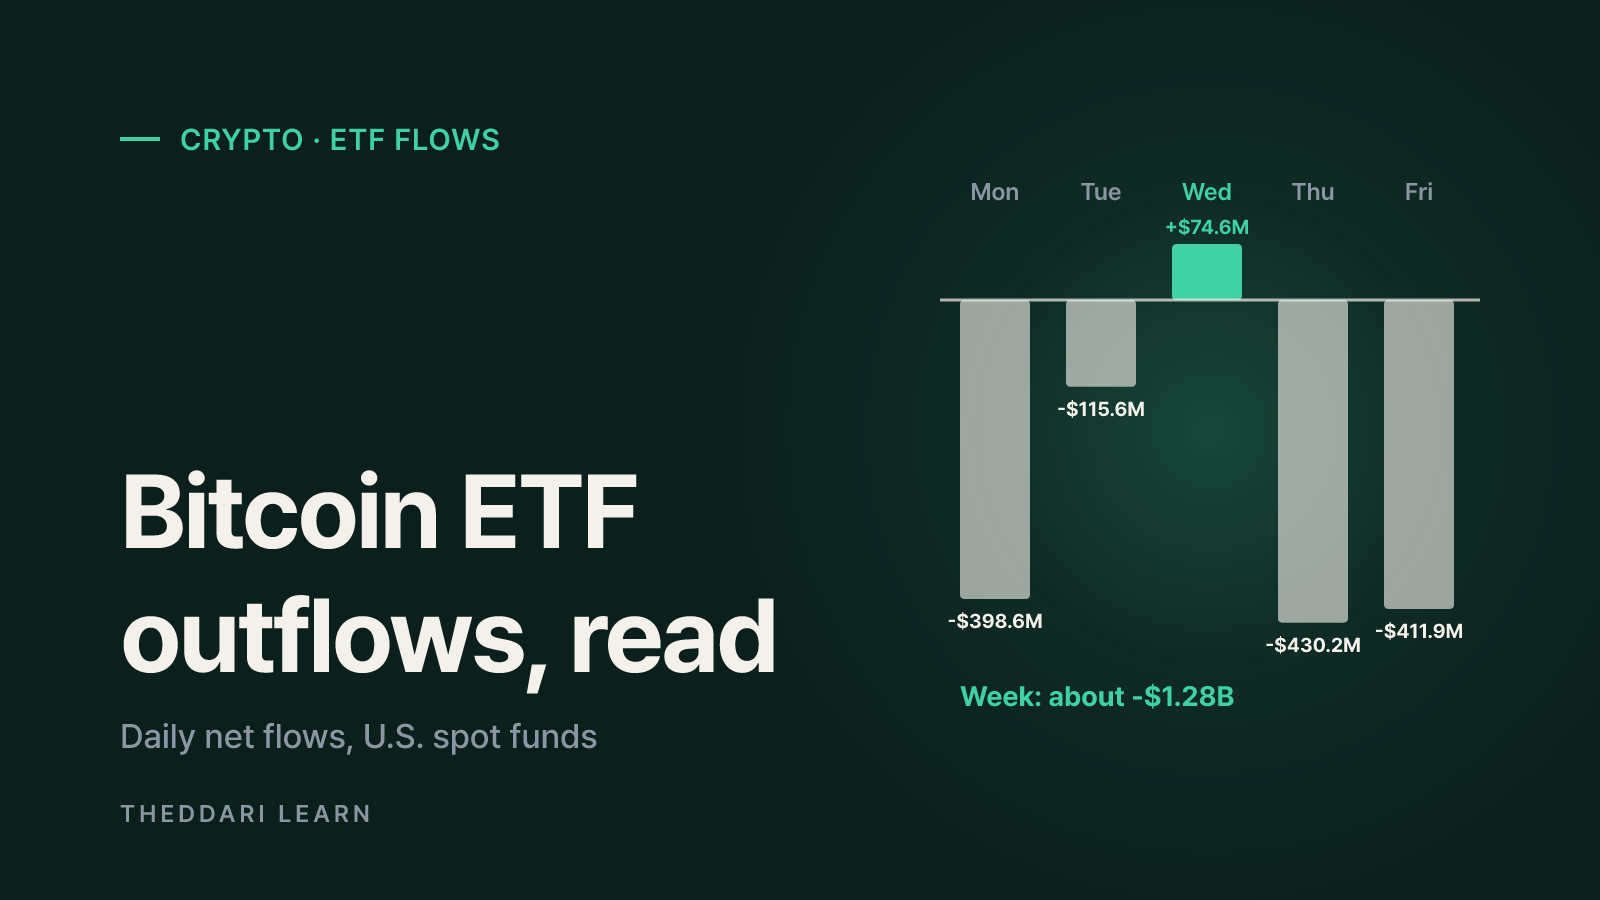
Derivatives data shows amplification. The catalyst usually sits in news, macro releases, spot ETF flows or large on-chain transfers at the same timestamp. Treat any unconfirmed explanation as a hypothesis.
Comparing funding across exchanges on one screen makes it easier to tell whether crowding was venue-specific or market-wide. The theddari funding arbitrage page shows funding differences between exchanges and can serve as a quick cross-check of positioning before and after a move. It is a comparison tool, not a forecast of where price goes next.
Four price and open interest patterns to recognize
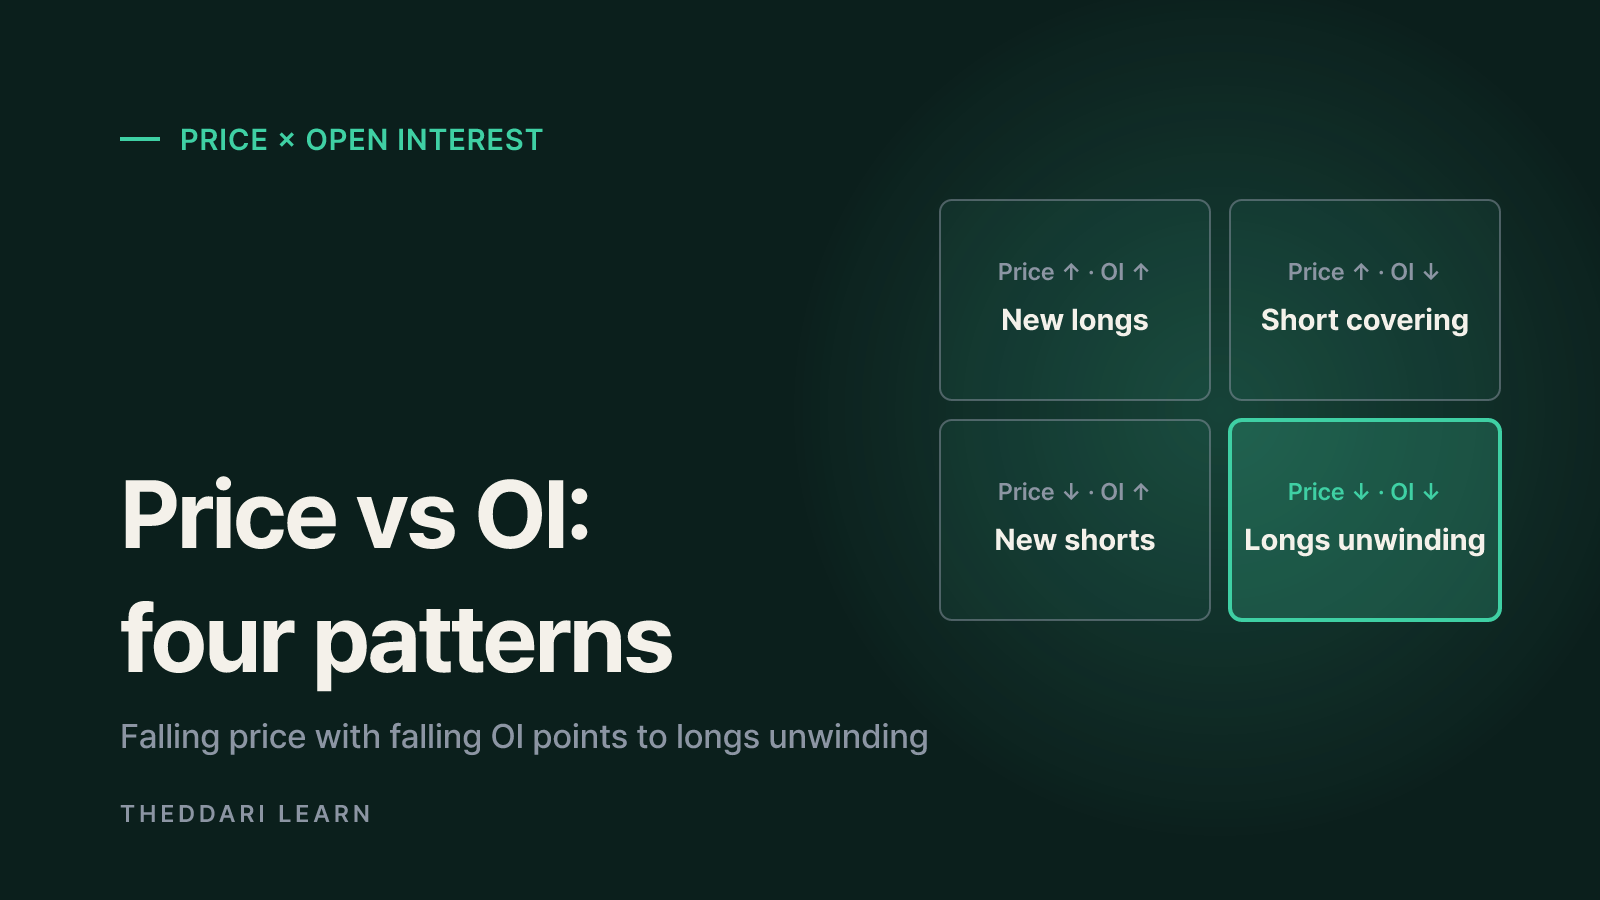
Pairing the direction of price with the direction of open interest gives a rough read on what kind of move you are looking at. The table below reflects a common framework in futures analysis. Treat each row as a hypothesis to test with funding and liquidation data, using aggregate figures across major exchanges where possible.
Down
- Open interest
- Down
- Common reading
- Longs closing or being liquidated
- Confirm with
- Long liquidation share, prior funding
Down
- Open interest
- Up
- Common reading
- New shorts pressing the move
- Confirm with
- Funding flipping negative
Up
- Open interest
- Down
- Common reading
- Short covering or short squeeze
- Confirm with
- Short liquidation size
Up
- Open interest
- Up
- Common reading
- New longs entering
- Confirm with
- Signs of overheated funding
The most common pattern after a sudden Bitcoin drop is falling price with falling open interest. If funding had been high and long liquidations spiked, that is the classic deleveraging signature. When price falls while open interest rises and funding turns negative, new shorts may be driving the decline, which also sets up the possibility of a sharp short squeeze if price rebounds. Whichever pattern you see, spot volume and the news timeline at the same moment add confidence to the interpretation.
How a liquidation cascade builds
A cascade is a feedback loop. Price slips, the mark price reaches some longs' liquidation levels, and their forced sell orders hit the book. If bids are thin, that selling pushes price lower and reaches the next tier of liquidation prices. Higher leverage puts liquidation prices closer to entry, so the loop can run several times within minutes. It stops when enough leverage has been cleared or buyers step in. A steep drop in open interest right after the crash is the footprint of that loop having run.
Limits of liquidation and funding data
Dashboards that aggregate liquidations differ in which exchanges they include and how they collect the data, and not every exchange publishes every forced order in real time. Treat liquidation totals as estimates. The more reliable signals are relative: how large the figure was compared with a normal day, and whether longs or shorts took the hit.
- Funding intervals and caps differ by exchange, so normalize rates to the same period before comparing them.
- Open interest quoted in US dollars falls when price falls even if contract count is unchanged. Check the BTC-denominated figure too.
- Liquidation data is an outcome. It does not reveal who sold first or why.
- Some exchanges, including OKX, change funding intervals or caps during extreme moves, so crash-day funding may not be comparable with normal days.
- Regional spot prices, such as on Korean won exchanges, can move independently of offshore futures and carry their own premium.
To line up the derivatives timeline with what people were reacting to, the theddari Telegram crypto trends page lets you scan crypto chatter in time order. Matching those timestamps with your funding and liquidation notes helps narrow down possible triggers. Channel posts can include unverified rumors, so confirm anything important against the original announcement.
In short: use pre-crash funding and open interest to see how much leverage was stacked and on which side, use liquidation direction and size to see how much was forcibly unwound, and use the post-crash open interest decline to gauge the size of the flush. If that explains why the drop was so steep, the remaining question is what set it off, and that answer lives in the news, macro calendar and spot flows. If you trade with leverage yourself, keep an eye on your liquidation price and maintenance margin ratio, and remember that a stop-loss does not guarantee you avoid forced liquidation.