What Is Bitcoin Capitulation? Signals and Their Limits
Bitcoin capitulation explained: how to read realized losses, volume spikes and long-term holder selling, what 2022 taught us, and why bottom calls fail.
Contents9 sections
- What bitcoin capitulation actually describes
- Reading realized loss: size, duration and scale
- How to interpret a volume spike
- Long-term holder selling: the 155-day line and LTH-SOPR
- Case study: what June and November 2022 taught
- Limits of capitulation indicators
- A checklist for reading the data as of November 2026
- Frequently asked questions
- Sources and references
Key takeaways
- Bitcoin capitulation is market shorthand for a phase when holders sitting on losses sell en masse and lock those losses in. There is no official definition or single threshold.
- Realized loss sums the USD loss on coins that moved below the price at which they last moved. Read its size, its duration and its size relative to market cap, not just the headline number.
- Glassnode treats coins held for roughly 155 days or more as long-term holder supply. Whether those holders sell below cost (LTH-SOPR under 1) is a key clue to how deep a capitulation runs.
- In June 2022 Glassnode described capitulation across the board, yet the price fell below that June low again after FTX collapsed in November. A capitulation signal does not date the bottom.
- As of Glassnode's November 11, 2026 report, bitcoin sat below the short-term holder cost basis. That is a recent-buyer loss zone, not a confirmed long-term holder capitulation.
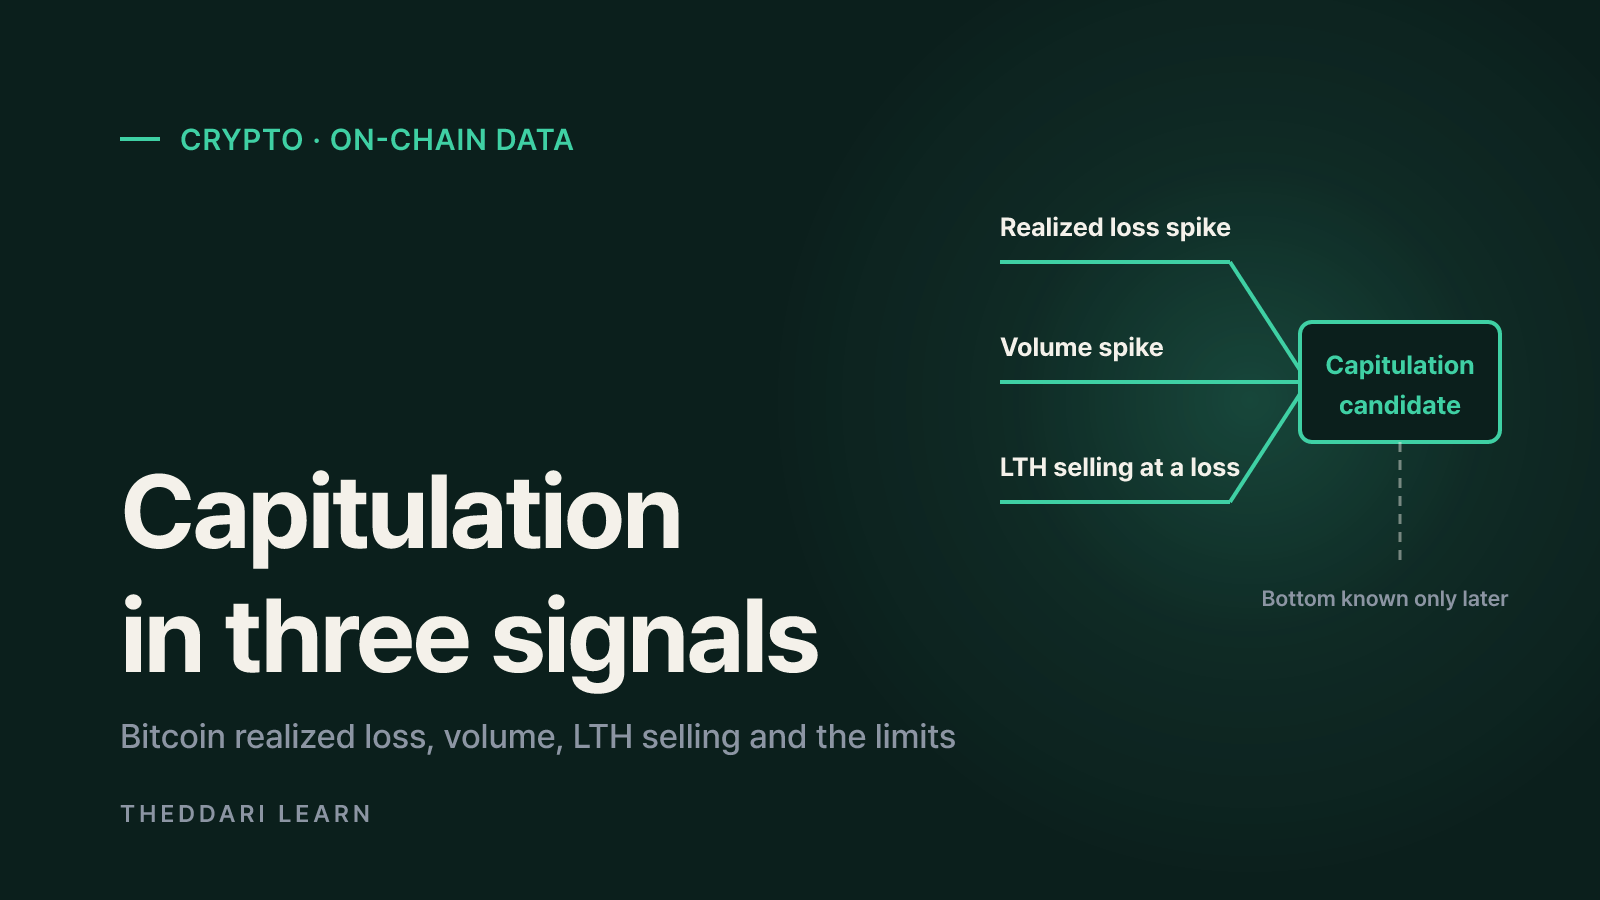
Bitcoin capitulation is the phase of a sell-off when holders who have been sitting on losses finally give up and sell in size, turning paper losses into realized ones. Analysts usually look for three things at once: a sharp jump in realized losses, a spike in volume, and long-term holders selling below their cost basis. None of these has an official threshold, and the 2022 bear market showed that a textbook capitulation can still be followed by lower prices. This guide, based on Glassnode documentation and research read as of November 16, 2026, explains what each signal measures, how to read it, and where it misleads. It is about interpreting data, not timing a bottom.
What bitcoin capitulation actually describes
In a long downtrend, a growing share of holders end up owning coins below what they paid. Those losses stay on paper until the coins move. Capitulation is the point where fear, forced liquidations, margin calls or a major failure, such as a lender or exchange collapse, push many of those holders to sell within a short window. In its June 2022 report, Glassnode described capitulation signals appearing across miners, long-term holders and the aggregate market at the same time. So capitulation is less a single metric than a description of several groups selling at a loss together.
Phrases like the "capitulation spiral" capture the feedback loop: falling prices trigger loss-taking, which pushes prices lower and triggers more. Analysts then ask a separate question, whether seller exhaustion follows. Extreme selling and the absence of remaining sellers are not the same thing, and the gap between the two is where most bad bottom calls come from.
Reading realized loss: size, duration and scale
According to Glassnode's documentation, Realized Loss is the total USD loss of all coins that moved at a price lower than the price at their previous movement. In formula terms it is the coin amount multiplied by the previous-move price minus the current-move price, summed over loss-making spends. Glassnode introduced the metric in June 2020. Because it relies on on-chain movement, the "purchase price" is really the price when a coin last moved, which is an estimate of cost, not a broker statement.
Three questions to ask of any realized loss spike
- How big? Compare the daily or seven-day total with past crashes. In June 2022, realized losses topped $2.4 billion a day for three consecutive days, $7.325 billion in total, a record at the time.
- How long? A one-day spike can be a single event. Elevated losses that persist for days or weeks say more about broad surrender.
- Relative to what? USD figures grow as the price rises, so compare across cycles in BTC terms or as a share of market cap. Glassnode compared the November 2022 sell-off using BTC-denominated seven-day net realized profit and loss for this reason.
Pair the dollar figure with SOPR (Spent Output Profit Ratio), the ratio of the price at which coins are spent to their estimated acquisition price. A value below 1 means coins are, on average, being sold at a loss. A large realized loss with SOPR near 1 points to heavy volume at shallow losses. A deeply depressed SOPR points to holders accepting large percentage losses, which is closer to what most people mean by capitulation.
How to interpret a volume spike
Volume is the most quoted capitulation signal and the easiest to misread. Because realized loss is coin amount times loss per coin, higher volume mechanically raises the dollar figure even when the loss per coin is modest. And not every surge is loss-taking. Forced futures liquidations, arbitrage between exchanges, fund rebalancing and internal exchange wallet moves all add volume. Exchange-reported spot volume, derivatives volume and on-chain transfer volume are also different datasets that should not be mixed.
Treat volume as confirmation rather than proof. The signal becomes stronger when a volume spike coincides with rising realized losses, SOPR below 1 and more old coins moving. If you want to know how much of a crash came from leverage, check funding rates and open interest alongside spot data. The theddari funding-rate arbitrage page shows funding across exchanges; a sharp swing to negative funding suggests derivatives positioning, not spot holders, did much of the selling.

Long-term holder selling: the 155-day line and LTH-SOPR
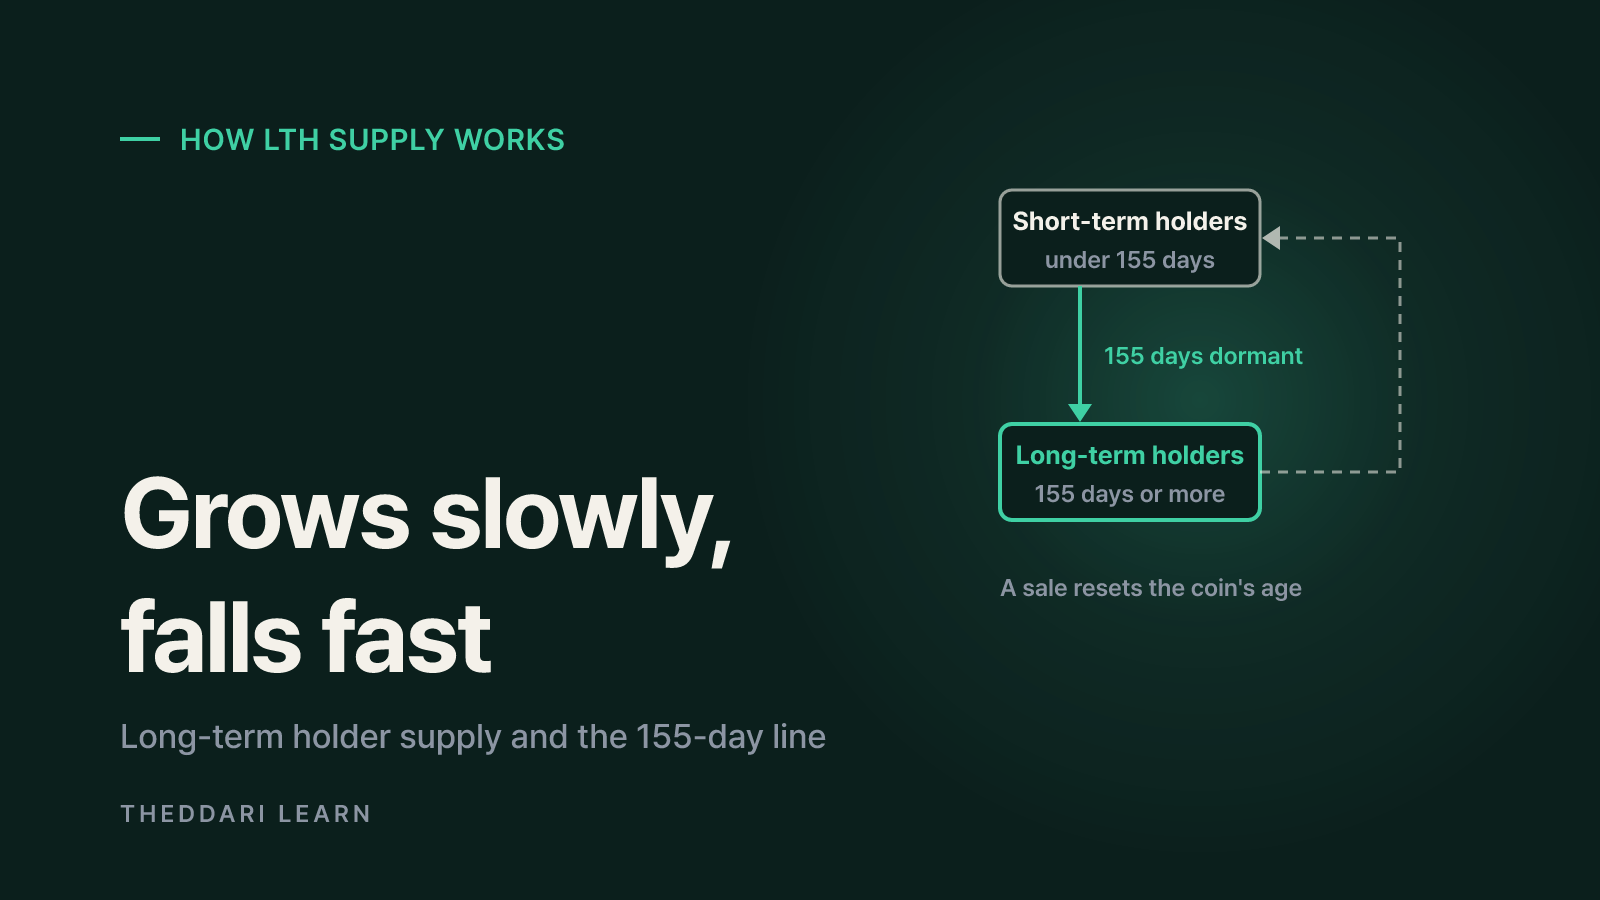
Glassnode splits supply into long-term holders (LTH) and short-term holders (STH) based on research showing that coins dormant for about 155 days become statistically unlikely to move. The boundary is smoothed around 155 days with a 10-day transition width, holders are grouped as entities rather than single addresses, classification uses each entity's average purchase date, and exchange balances are excluded. When a long-term holder sells, the coin's age resets to zero and it becomes short-term supply. That is why LTH supply grows slowly but can fall quickly.
LTH supply
- What it shows
- Coins held by the 155-day-plus cohort
- What to watch in a capitulation
- Declines that last weeks, not days
LTH-SOPR
- What it shows
- LTH spend price ÷ estimated cost
- What to watch in a capitulation
- Below 1 means loss-taking; past bear lows hit 0.4 to 0.6
LTH-MVRV
- What it shows
- Market price ÷ LTH average cost
- What to watch in a capitulation
- Below 1 means the cohort is underwater on average
Revived supply 1y+
- What it shows
- Old, dormant coins moving again
- What to watch in a capitulation
- Whether a spike fades or becomes a trend
In the June 2022 report, LTH supply fell by 178,000 BTC in a week, or 1.31% of the cohort's holdings, and LTH-MVRV dropped to 0.85, a 15% average unrealized loss. The same report said LTH-SOPR had fallen into the 0.4 to 0.6 range at past bear market lows. By July, LTH-SOPR read 0.67, meaning the average long-term holder who sold was locking in a 33% loss. Glassnode added an important caveat: the largest long-term holder outflows have come during bull markets as profit-taking. Selling volume alone is not capitulation; selling at a loss is the part that counts.
Case study: what June and November 2022 taught
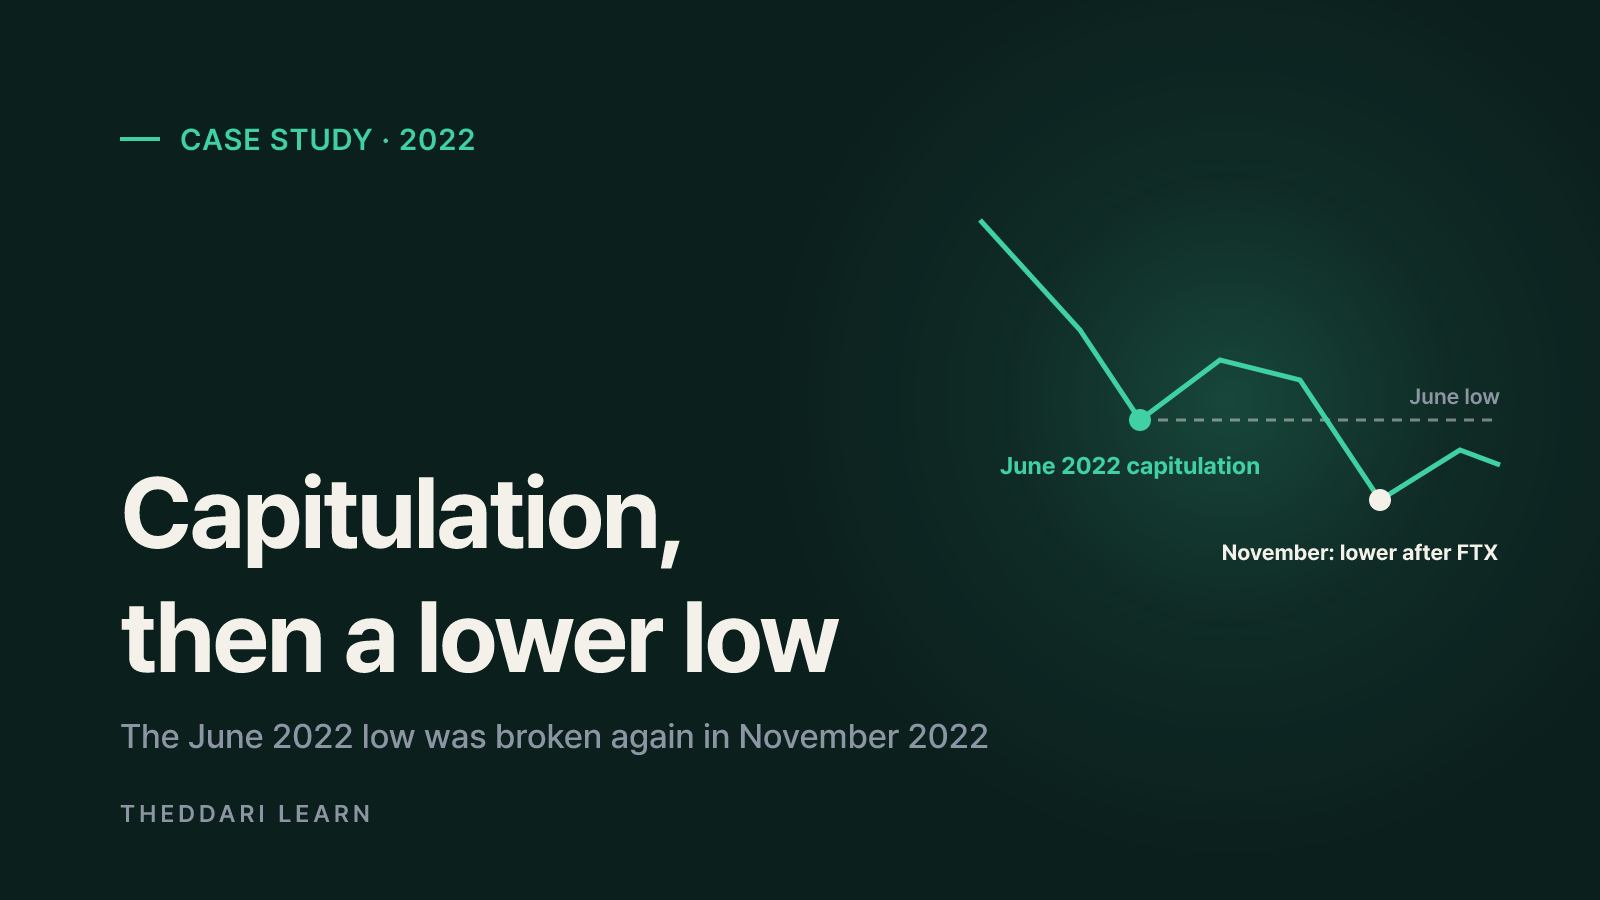
In the June 20, 2022 report, bitcoin hit $17,708 on June 18 while realized losses set a record. The MVRV ratios of the whole market, short-term holders and long-term holders were all below 1, a combination Glassnode said had only coincided with late-stage bear market capitulations. Yet three weeks later, the July 11 report concluded that while the fingerprint of widespread capitulation was in place, a resilient bottom might still require more time and further downside.
That caution proved warranted. After FTX collapsed, the price traded around $16,000, below the June low. The November 28 report called it the fourth-largest capitulation on record, with a seven-day realized loss of $10.16 billion, 4.0 times the December 2018 peak and 2.2 times March 2020. Two weeks earlier, the November 14 report found LTH supply down 61,500 BTC since November 6 but judged it too early to infer a widespread loss of conviction, framing the key question as whether the spike was an event or a trend.
The June and November figures use different windows: a three-day total versus a seven-day total. Align the period and the unit before concluding that one episode was larger than the other.
Limits of capitulation indicators
The biggest trap is hindsight bias. Once a bottom is known, the last large loss spike before it looks like the obvious final capitulation. In real time, nobody in June 2022 knew that a bigger shock was five months away. Glassnode's own November 2022 conclusion notes that the few historical analogues form a small sample and were identified as points of seller exhaustion only in hindsight. Bitcoin has had only a handful of major bear market lows, which is thin ground for statistical rules.
- Model assumptions: the 155-day cut-off, entity clustering and exchange address labels are all estimates. An address is not a person.
- Data revisions: Glassnode notes that entity-adjusted series can revise recent values as clustering improves, so the number you saw live may differ from the one you see later.
- Structural change: as spot ETFs and custodians hold more bitcoin, some selling can happen inside custody ledgers without a matching on-chain move.
- Crowded signals: when many traders watch the same indicator, the price response after a signal may not match history.
- Price reference: most on-chain metrics are priced in USD. Prices on local-currency exchanges can diverge, so compare like with like.
A checklist for reading the data as of November 2026
Glassnode's November 11, 2026 report put bitcoin near $74K, below the short-term holder cost basis of $75.6K. At the September high almost all short-term holder coins were in profit; now about 35% are, and sellers are taking small losses on average. Stablecoin supply fell by $14.2B over 30 days, and US spot ETFs saw $1.6B of net outflows over 20 sessions. The report used the June low of $58.5K as the line for its trend view. These readings describe a recent-buyer loss zone, which is different from the deep long-term holder loss-taking and record realized losses seen in 2022. Some of the report's data runs only through November 9.
- 1
Identify who is underwater
Separate short-term holder losses from long-term holder losses. Price below the short-term holder cost basis is common in ordinary corrections.
- 2
Measure realized loss size and duration
Check whether losses are a one-day spike or persist, and compare in BTC terms or relative to market cap. Align windows before comparing episodes.
- 3
Check whether long-term holders sell at a loss
Look for LTH supply declining over weeks together with LTH-SOPR below 1. Rising LTH spending without losses may simply be profit-taking.
- 4
Separate the drivers of volume
Use funding rates and open interest to estimate the leverage component, and check whether exchange inflows and realized losses rose together.
- 5
Match the narrative to the timestamps
Record each report's data cut-off and price time, and check whether a specific event, such as a failure or regulatory action, drove the selling.
Narratives often spread faster than data. The theddari Telegram crypto trends page can show when words like capitulation or bottom started trending, which helps you check whether a claim is backed by an actual report or just repeated.
In short, capitulation is the label for a moment when realized losses, volume and long-term holder loss-taking hit extremes together. The more signals line up, the stronger the evidence that selling was extreme, but none of them proves the low is in. Record the data date, the window, the unit and the model assumptions behind every reading, and watch how the picture develops over weeks rather than reacting to a single spike.
Frequently asked questions
Does a capitulation signal mean bitcoin has bottomed?
What is the difference between realized and unrealized loss?
Is long-term holder selling always bearish?
Can trading volume alone identify capitulation?
Why do USD realized loss records keep getting broken?
Sources and references
- 1Glassnode Docs: Realized Loss(opens in a new tab)docs.glassnode.com
- 2Glassnode Docs: Supply Held by Long and Short-Term Holders(opens in a new tab)docs.glassnode.com
- 3Glassnode: Falling Dominoes: Capitulations Across the Board (2022-06-20)(opens in a new tab)research.glassnode.com
- 4Glassnode: Pressure Builds on Diamond Hands (2022-07-11)(opens in a new tab)research.glassnode.com
- 5Glassnode: The Fall of FTX (2022-11-14)(opens in a new tab)research.glassnode.com
- 6Glassnode: The Character of Capitulation (2022-11-28)(opens in a new tab)research.glassnode.com
- 7Glassnode: Running on Empty (2026-11-11)(opens in a new tab)research.glassnode.com
Related articles
 Crypto
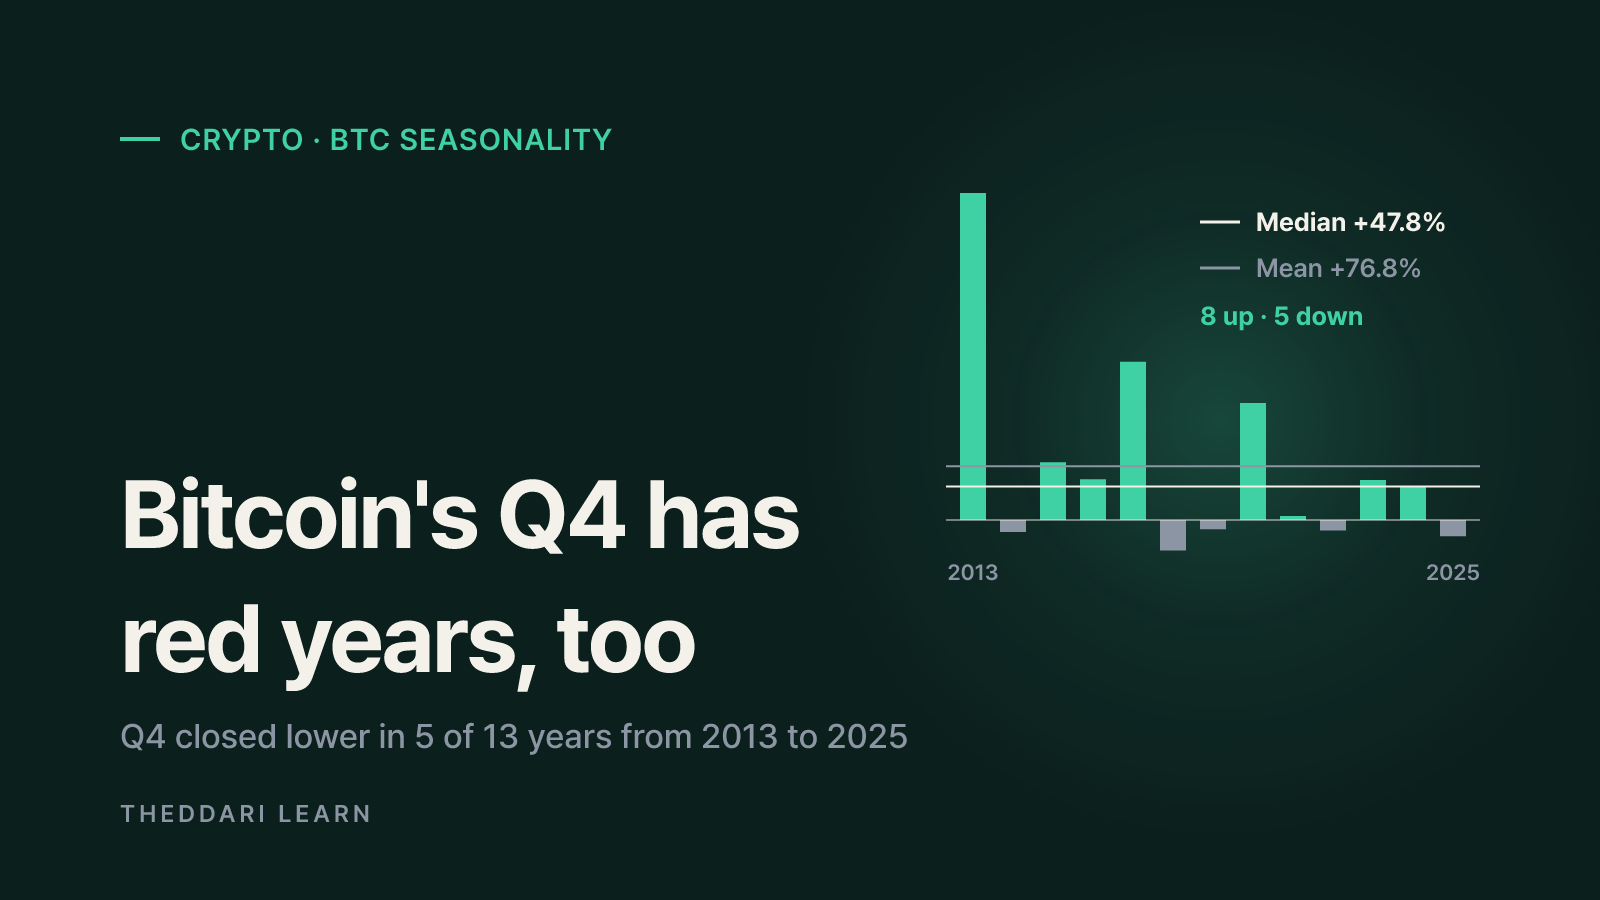
Bitcoin Q4 Seasonality: How to Read Quarterly Return Stats
Bitcoin Q4 return tables show that strong fourth quarters were common, not certain. Here is how to read the median, the sample window and the halving-cycle overlap before you lean on seasonality.
 Crypto
What Is the Akedo Token (AKE)? Checks Before You Buy
The Akedo token (AKE) hit No. 1 on CoinGecko's trending list. Here is what the AI game-creation platform does and what to verify on supply, unlocks, liquidity and disclosures, as of November 14, 2026.
 Crypto
Nvidia Bitcoin Correlation: Does Bad Nvidia News Move BTC?
Nvidia and bitcoin fell together on November 12, 2026, after Jensen Huang resigned. Falling on the same day is not proof of cause. Here is what research says about bitcoin's link to tech stocks and a step-by-step way to test the Nvidia connection yourself.