Contents7 sections
- What happened to Nvidia and bitcoin when Jensen Huang resigned
- How correlated are bitcoin and tech stocks? The numbers by period
- How to measure the Nvidia bitcoin correlation yourself
- Correlation is not causation: what else hit bitcoin that week
- Common mistakes and risks
- Frequently asked questions
- Sources and references
The Nvidia bitcoin correlation is real but mostly indirect: bad news at Nvidia tends to reach bitcoin through a broader risk-off mood in tech stocks, not through any direct link between the chipmaker and the coin. On November 12, 2026 (US Eastern time), Jensen Huang resigned as Nvidia's CEO effective immediately. Nvidia shares fell as much as 16% intraday and closed down 4.3% (NBC News), while bitcoin dropped to about $71,670, its lowest level since mid-August (Bitcoin Magazine). This guide, based on sources checked as of November 14, 2026, explains what the data says and how to test the relationship yourself without mistaking coincidence for cause.
What happened to Nvidia and bitcoin when Jensen Huang resigned
Nvidia said Huang stepped down as president, CEO and board member. CFO Colette Kress became interim CEO while keeping the CFO role, and Harvey C. Jones was named the company's first board chair. Nvidia's fiscal third-quarter earnings report remained scheduled for November 17 (Bitcoin Magazine). Governance questions are outside the scope of this guide; the focus here is how prices moved.
Nvidia (NVDA)
- Move on Nov 12, 2026
- Down about 13% at the open, as much as 16% intraday, closed down 4.3%
- Source
- Bitcoin Magazine, NBC News
Nasdaq-100 futures
- Move on Nov 12, 2026
- Down about 1.4% before the open
- Source
- Bitcoin Magazine
S&P 500 futures
- Move on Nov 12, 2026
- Down about 0.7% before the open
- Source
- Bitcoin Magazine
Philadelphia Semiconductor Index
- Move on Nov 12, 2026
- Closed down 0.5%
- Source
- NBC News
Bitcoin
- Move on Nov 12, 2026
- Slid from about $74,700 to about $71,670
- Source
- Bitcoin Magazine
Notice the gap: Nvidia's fall was far larger than the move in the chip index or the broad index futures, so the shock was concentrated in one stock. Yet bitcoin lost roughly 4% over the session. That is exactly why you need to separate an Nvidia effect from everything else going on that week. To see which stories crypto communities were discussing at the same time, the Theddari crypto Telegram trends page groups the most-mentioned topics.

How correlated are bitcoin and tech stocks? The numbers by period
No official body publishes an ongoing Nvidia-versus-bitcoin correlation. The better-documented question is bitcoin versus stock indexes. CME Group's economic research team measured the daily-return correlation between bitcoin (XBTUSD) and both the S&P 500 and Nasdaq-100 from January 2014 through April 14, 2025 (CME Group).
Jan 2014 - Dec 2016
- BTC vs S&P 500
- -0.01
- BTC vs Nasdaq-100
- 0.00
Jan 2017 - Dec 2019
- BTC vs S&P 500
- 0.01
- BTC vs Nasdaq-100
- 0.02
Jan 2020 - Dec 2022
- BTC vs S&P 500
- 0.40
- BTC vs Nasdaq-100
- 0.42
Jan 2023 - Apr 14, 2025
- BTC vs S&P 500
- 0.30
- BTC vs Nasdaq-100
- 0.30
Full period
- BTC vs S&P 500
- 0.20
- BTC vs Nasdaq-100
- 0.20
Before 2020 there was essentially no relationship. From 2020 the link turned clearly positive. Because the S&P 500 and Nasdaq-100 numbers are almost identical, CME reads bitcoin's behavior as tied to the stock market broadly rather than to tech specifically. Since Nvidia is one of the heaviest Nasdaq-100 weights, a large part of any Nvidia-bitcoin link is probably this same market-wide factor.
Correlation rises in selloffs
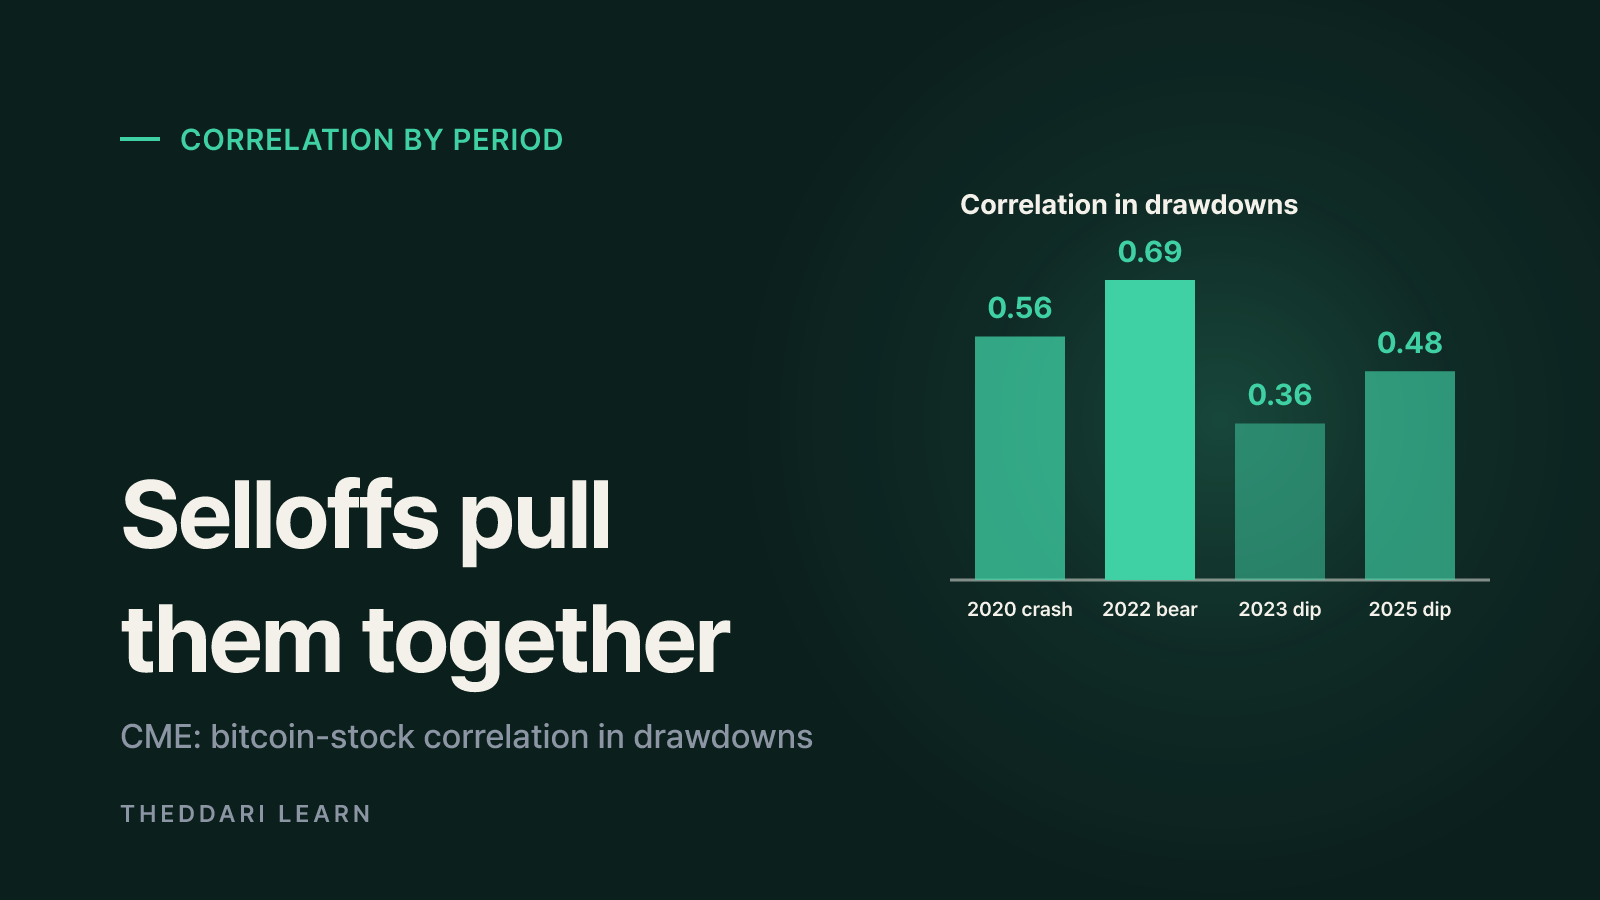
CME found the 60-day rolling correlation mostly sat between -0.2 and 0.2 before 2020, then ranged from 0.0 to 0.6, reaching about 0.48 in early April 2025. It ran highest during drawdowns: 0.56 in February-March 2020, 0.69 from November 2021 to December 2022, 0.36 in July-October 2023 and 0.48 in January-April 2025. CME calls this an asymmetric relationship. In plain terms, a risk-off selloff is when bitcoin is most likely to fall alongside stocks.
Same direction, bigger swings
Correlation only measures whether two assets move in the same direction. In the same study, bitcoin's daily standard deviation from 2014 to April 14, 2025 was 4.27%, versus 1.38% for the Nasdaq-100 and 1.12% for the S&P 500. Using the 2023-2025 figures, a rough beta of bitcoin to the Nasdaq-100 is 0.30 x (3.24% / 1.33%), or about 0.73. A modest correlation can still translate into large bitcoin moves on a bad tech day.
How to measure the Nvidia bitcoin correlation yourself
Charting platforms offer a correlation indicator, but building it in a spreadsheet lets you control the dates and timing. Here is a simple process.
- 1
Align the timestamps
Download daily NVDA closes and bitcoin prices taken at the same moment. US stocks close at 4 p.m. Eastern, while bitcoin trades 24/7, so use bitcoin's price near that time and drop weekends and US market holidays. Misaligned clocks can shift a move into the wrong day and distort the result.
- 2
Convert prices to returns
Correlating raw prices inflates the number whenever both assets trend up for a long time. Compute daily returns as (today's close / yesterday's close) - 1. CME's study also used daily returns.
- 3
Use several rolling windows
Apply the CORREL function over 30-, 60- and 90-day windows. Short windows react quickly but are noisy; long windows are steadier but slow to show change.
- 4
Benchmark against the Nasdaq-100
Run the same calculation for bitcoin versus the Nasdaq-100. If the Nvidia figure is about the same, you are seeing general risk appetite. Only a clearly higher Nvidia reading suggests an AI-chip-specific link.
- 5
Check the event window
Look at hourly prices around the headline. If bitcoin started falling before the news, something else was likely driving it. Mark major economic releases and big earnings dates over the same period.
For the last step, the Theddari economic calendar lists inflation and jobs releases, and the earnings calendar shows when market-moving companies like Nvidia report. Treat them as schedules to check for overlapping events, not as forecasting tools.
Correlation is not causation: what else hit bitcoin that week
CME stresses that correlation does not equal causation and that confounding variables, factors affecting both assets, can create the pattern. Investors often hold stocks and crypto in the same portfolio, and bitcoin is easy to sell for cash when markets get stressed. According to Bitcoin Magazine, several other pressures overlapped with the Nvidia news:
- Inflation: a hotter-than-expected CPI report on Tuesday, November 10, had already pushed bitcoin to a low near $72,700.
- Rates: CME FedWatch showed traders treating a December Fed rate hike as a near certainty, which weighs on an asset that pays no interest.
- MSCI decision: MSCI confirmed it would remove Strategy (MSTR), the largest corporate bitcoin holder, from its indexes at the November 30 close. Index funds sell MSTR shares, not bitcoin, but the move raised doubts about the company's buying power.
- ETF flows: US spot bitcoin ETFs saw $299.8 million in net outflows on November 11, a fifth straight day, for about $1.44 billion over five days.
- Timing: bitcoin's selling began after the US close on November 11, before the resignation was announced.
With that many drivers, a single day's prices cannot isolate Nvidia's share. The defensible statement is that Nvidia and bitcoin fell together inside the same risk-off move.
Before trusting a video or post that links a headline to a crypto drop, check three things: when the drop started relative to the news, what else was scheduled that week, and whether the link to Nvidia is stronger than the link to the Nasdaq-100.
Common mistakes and risks
- Projecting old correlations forward: the relationship shifted from 0.02 to 0.42 between periods in CME's data. There is no guarantee the current level holds.
- Relying on one short window: a few days of joint losses can swing the reading sharply.
- Mixing company news with market news: issues specific to Nvidia may barely touch bitcoin unless they spread to the wider market. On November 12, the chip index fell only 0.5%.
- Ignoring volatility: even a 0.30 correlation pairs with much larger bitcoin swings, which raises liquidation risk on leveraged positions.
- Trusting token names: AI-themed tokens that react to Nvidia headlines are trading on narrative, not on any claim to Nvidia's business.
In short, judge whether bad Nvidia news is moving bitcoin with four checks: return-based rolling correlation, a Nasdaq-100 benchmark, event timing and overlapping events. That approach works for the November 17 earnings report and the next chip-sector headline alike.