Contents8 sections
- What bitcoin Q4 return tables actually measure
- Mean vs median: why the start year changes the answer
- The halving cycle overlap
- What happened in Q4 2025 and Q4 2026 so far
- How to check bitcoin seasonality data yourself
- Risks to weigh before any seasonal pattern
- Frequently asked questions
- Sources and references
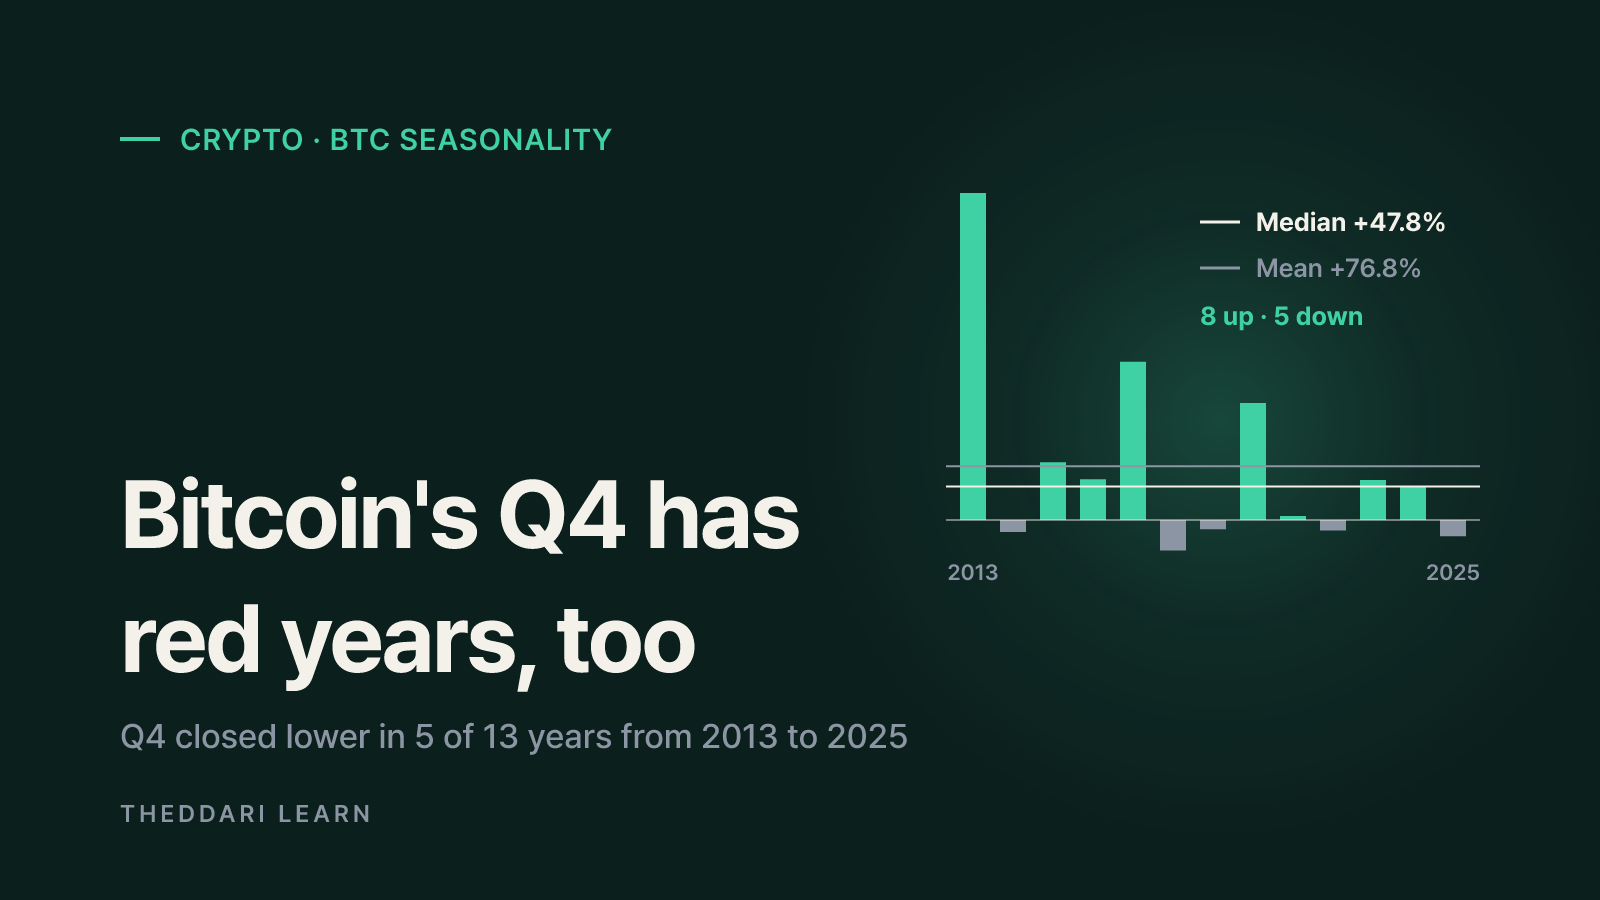
Bitcoin Q4 has historically been its strongest quarter by median return, but it has not risen every year. As of November 15, 2026, public return tables show that bitcoin closed the fourth quarter higher in 8 of the 13 years from 2013 through 2025 and lower in the other 5. This guide explains what a bitcoin seasonality table can and cannot tell you, focusing on three limits: a small sample, the gap between the mean and the median, and the overlap with the four-year halving cycle. It does not offer a price target, and exact figures vary slightly by data provider.
What bitcoin Q4 return tables actually measure
A quarterly return compares the last close of a quarter with the last close of the previous quarter. Coinfuty builds monthly returns from daily futures closes in US dollars and compounds three months into each quarter. CoinGlass uses spot prices from major exchanges with periods rolling over at 00:00 UTC. Both approaches are reasonable, but mixing numbers from different providers in one comparison introduces small, avoidable errors.
Here are the fourth-quarter returns from Coinfuty's table for 2013 through 2025. Two things stand out: the winning years were enormous, and the losing years were often double-digit declines.
2013
- Q4 return
- +467%
- Year
- 2020
- Q4 return
- +167%
2014
- Q4 return
- -17.3%
- Year
- 2021
- Q4 return
- +5.5%
2015
- Q4 return
- +82.4%
- Year
- 2022
- Q4 return
- -14.8%
2016
- Q4 return
- +58.1%
- Year
- 2023
- Q4 return
- +57.0%
2017
- Q4 return
- +226%
- Year
- 2024
- Q4 return
- +47.8%
2018
- Q4 return
- -43.5%
- Year
- 2025
- Q4 return
- -23.1%
2019
- Q4 return
- -13.2%
- Year
- -
- Q4 return
- -
CoinGlass summarizes the same window with a Q4 median of +47.5%, well above the other three quarters, while noting that Q4 was still down in 5 of those 13 years. So the table describes a past tendency. It does not give you a reliable probability for this year. Thirteen observations are simply too few to separate a structural effect from luck, especially for an asset whose quarterly moves range from roughly -44% to more than +400%.
Mean vs median: why the start year changes the answer
Average the 13 values above and you get about +76.8% (a sum of roughly 998.9 divided by 13). Sort them and take the middle value, and the median is +47.8%. The gap of nearly 30 percentage points comes from outliers such as +467% in 2013 and +226% in 2017. A headline that says bitcoin gains more than 70% in an average Q4 is technically based on real data, yet it describes almost no actual year.
The result is also sensitive to a single year. Remove 2013 and calculate 2014 to 2025 only: the mean drops to about +44.3% and the median becomes the midpoint of +5.5% and +47.8%, roughly +26.7%. Go the other way and include Coinfuty's full record back to 2010, and the median is +28.1% with 10 of 16 fourth quarters positive. Depending on where the table starts, the typical Q4 return ranges from about +26.7% to +47.8%.
2013-2025
- Observations
- 13
- Q4 median
- +47.8%
- Positive years
- 8
2014-2025
- Observations
- 12
- Q4 median
- about +26.7%
- Positive years
- 7
2010-2025 (Coinfuty full record)
- Observations
- 16
- Q4 median
- +28.1%
- Positive years
- 10
Lead with the median and the win rate, and treat the mean as a warning that outliers exist. CoinGlass gives the same advice for its seasonality tables. Also check the first year in the table and whether the in-progress quarter is excluded.
The halving cycle overlap
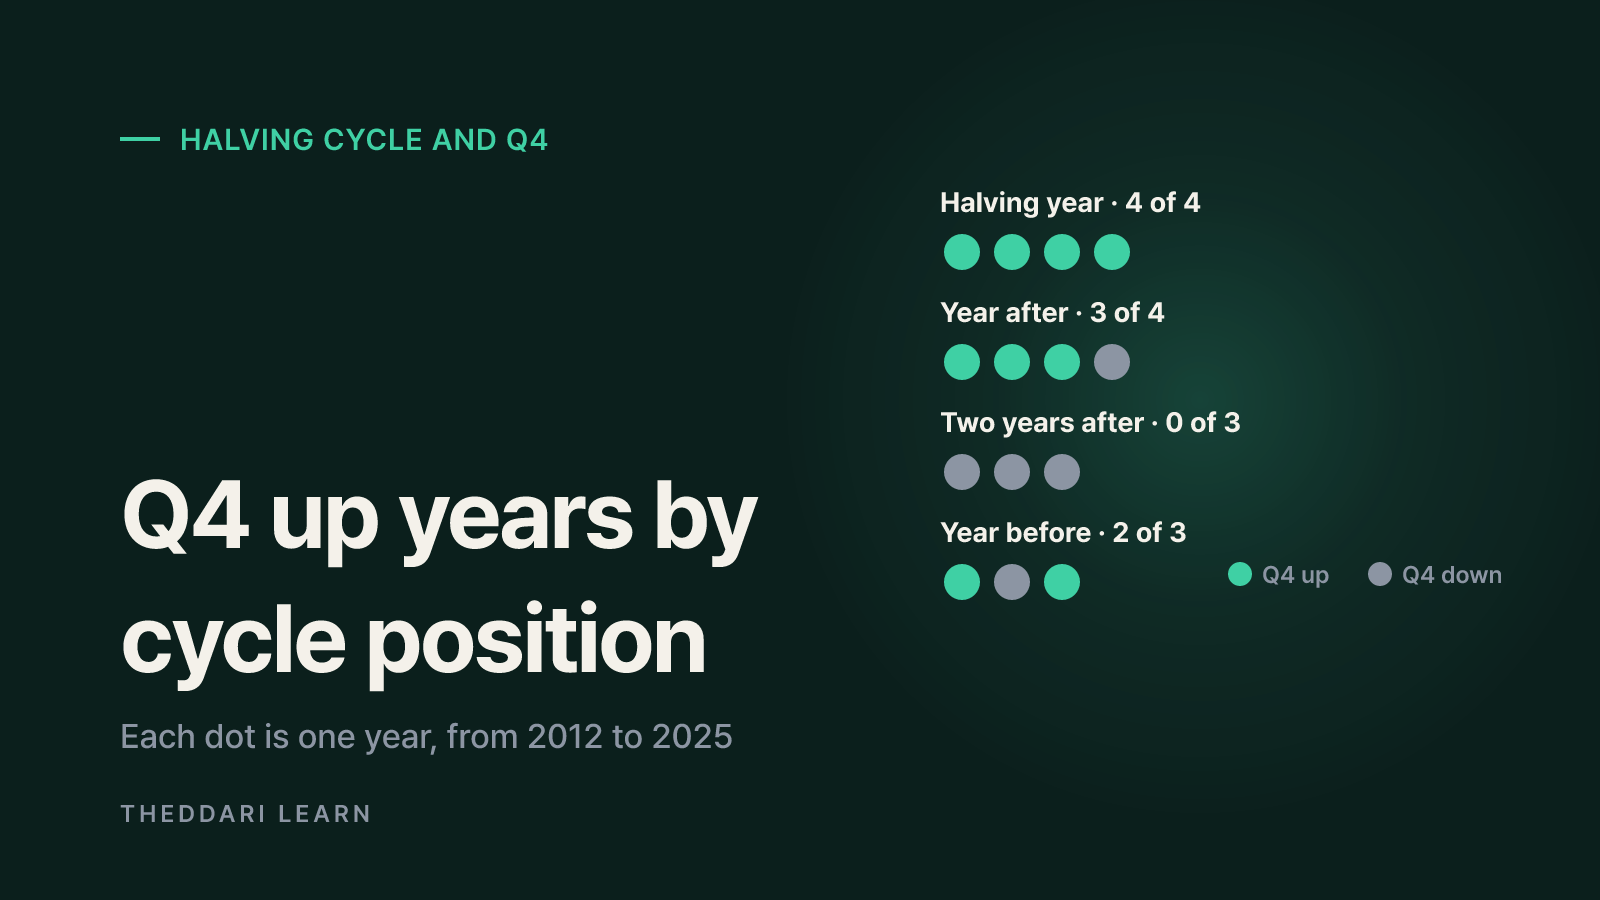
Every 210,000 blocks, roughly every four years, the bitcoin block reward is cut in half. According to Bitcoin.org's halving history, halvings occurred on November 28, 2012, July 9, 2016, May 11, 2020 and April 20, 2024. The strongest fourth quarters line up with specific years in this cycle, which makes it hard to say whether Q4 itself matters.
Halving year
- Years
- 2012, 2016, 2020, 2024
- Q4 returns
- +8.3%, +58.1%, +167%, +47.8%
- Positive
- 4 of 4
Year after halving
- Years
- 2013, 2017, 2021, 2025
- Q4 returns
- +467%, +226%, +5.5%, -23.1%
- Positive
- 3 of 4
Two years after
- Years
- 2014, 2018, 2022
- Q4 returns
- -17.3%, -43.5%, -14.8%
- Positive
- 0 of 3
Year before halving
- Years
- 2015, 2019, 2023
- Q4 returns
- +82.4%, -13.2%, +57.0%
- Positive
- 2 of 3
Grouped this way, every Q4 two years after a halving was negative, and the largest gains came the year after a halving. That raises a fair question: is Q4 seasonally strong, or were the fourth quarters of bull-market years strong? Each bucket holds only three or four data points, so this table is also a description rather than a rule. And 2025 already broke the pattern, finishing Q4 at -23.1% despite being the year after a halving.
Market structure keeps shifting too. Spot bitcoin exchange-traded products, interest rates and the share of institutional holders all differ from earlier cycles. CoinGlass itself notes that halving cycles, rates and ETF flows change every year, so past seasonality is background rather than a plan, and that three completed cycles make a tiny sample.
What happened in Q4 2025 and Q4 2026 so far
Recent data shows the limits clearly. Coinfuty's 2025 figures were Q1 -11.8%, Q2 +29.8%, Q3 +6.4% and Q4 -23.1%, making the fourth quarter the weakest of the year. In 2026, Q1 fell 22.1% and Q2 fell 14.1% before Q3 jumped 42.6%. Q4 2026 stood at -22.5% through the November 15 UTC close. That figure is provisional and will keep moving until the quarter ends on December 31.
Most tables keep the current quarter out of their averages and medians. CoinGlass marks unfinished cells with a dashed border and Coinfuty sets them in italics. Do not quote an in-progress Q4 number as a final result or compare it directly with medians built from completed years.
How to check bitcoin seasonality data yourself
- 1
Write down the method
Note the price source (spot or futures), the quote currency, the daily cutoff time and whether quarters are close-to-close or compounded from months. Keep figures from different providers in separate columns.
- 2
Count the observations
Check whether the table starts in 2010, 2011 or 2013 and count how many fourth quarters it includes. Recalculate the median with one year added or removed to see how fragile it is.
- 3
Separate mean, median and win rate
A mean far above the median signals outliers. Write the win rate as a fraction, such as 8 of 13, so the small sample stays visible.
- 4
Tag each year by cycle position
Label each year as a halving year, the year after, two years after or the year before, then compare like with like to see whether the calendar and the cycle are mixed together.
- 5
Add current data
Keep the in-progress quarter apart from the historical statistics and look at present conditions such as leverage, flows and macro events.
For present conditions, funding rate gaps across exchanges can hint at crowded leverage, and the price gap between Korean won exchanges and global venues reflects local demand. These theddari tools organize current data; they do not forecast price direction, so read them alongside seasonality rather than instead of it.

You can also scan which crypto narratives are circulating in Telegram channels. A popular Q4 rally story is not evidence by itself. As CoinGlass points out, once a seasonal pattern becomes famous, more traders try to front-run it, which can pull the move earlier or weaken it.
Risks to weigh before any seasonal pattern
In a September 2024 investor bulletin, the SEC's Office of Investor Education and Advocacy described bitcoin and ether as highly speculative investments, including when exposure comes through an exchange-traded product, and urged investors to weigh volatility and the potential loss of their investment. The bulletin addresses US investors, but the point about volatility applies to anyone holding bitcoin.
- Bitcoin has lost 43.5% in a single fourth quarter (2018). Size any position around the worst quarter, not the average one.
- Using leverage on a seasonal thesis can lead to liquidation during ordinary swings.
- In-progress quarter figures can change sharply within weeks, so an early reading says little about the final result.
- Fees, taxes and exchange rules depend on where you live and which platform you use, so check them separately.
In short, bitcoin's Q4 seasonality table shows that strong fourth quarters were common, and that much of that strength came from a few extreme years and from the halving cycle. Before relying on it, check the median and win rate, the sample window and each year's cycle position, then look at current positioning and flow data and keep any decision within a loss you can afford.