Contents7 sections
The bull market support band is the zone between Bitcoin's 20-week simple moving average and 21-week exponential moving average, both calculated from weekly closing prices. Traders call it support because Bitcoin's pullbacks in past bull markets often paused near it, but it is really a trend reference: it tells you where price sits relative to roughly the last five months. This guide, based on sources checked in October 2026, covers how the band is built, how to read it on a weekly chart, how it behaved in past cycles, and why it should not be treated as a trading rule on its own. It does not forecast a price level.
What is the bull market support band?
According to Alphabit's explainer, the 20-week SMA is the arithmetic mean of the most recent 20 weekly closes. The 21-week EMA weights recent weeks more heavily: each new weekly close is multiplied by 2/22 and added to the previous EMA multiplied by 20/22. That 2/22 weight is about 9.1%, compared with 5% for each week in a 20-week simple average, so the EMA reacts a little faster. Because the two lines cover a similar lookback but respond at different speeds, they trace a band rather than a single line.
Neither line is permanently on top. In uptrends the faster EMA usually sits above the SMA; in downtrends the order tends to flip. The band therefore runs from whichever average is lower that week to whichever is higher. The indicator was popularized on TradingView by the author zkdev, whose open-source script published on March 13, 2021 plots the 20-week SMA in green and the 21-week EMA in red and recommends reading it on the weekly chart.
20-week SMA
- Calculation
- Average of the last 20 weekly closes
- Behavior
- Equal weights; smoother and slower
21-week EMA
- Calculation
- New close × 2/22 + prior EMA × 20/22
- Behavior
- Heavier recent weight; turns sooner
Band
- Calculation
- From the lower average to the higher one
- Behavior
- Top and bottom can swap over time
Why different charts show different values
Two websites can show different band values on the same day. The weekday and time zone that close a week, the exchange or aggregator supplying prices, and the way the EMA is initialized all change the result. Some tools approximate the band on daily data with a 140-day SMA and a 147-day EMA, and some include the unfinished current week at the live price, so their numbers move until Sunday's close. Before comparing readings, confirm the data source and whether the values use completed weekly closes.
How to read the band on a weekly chart
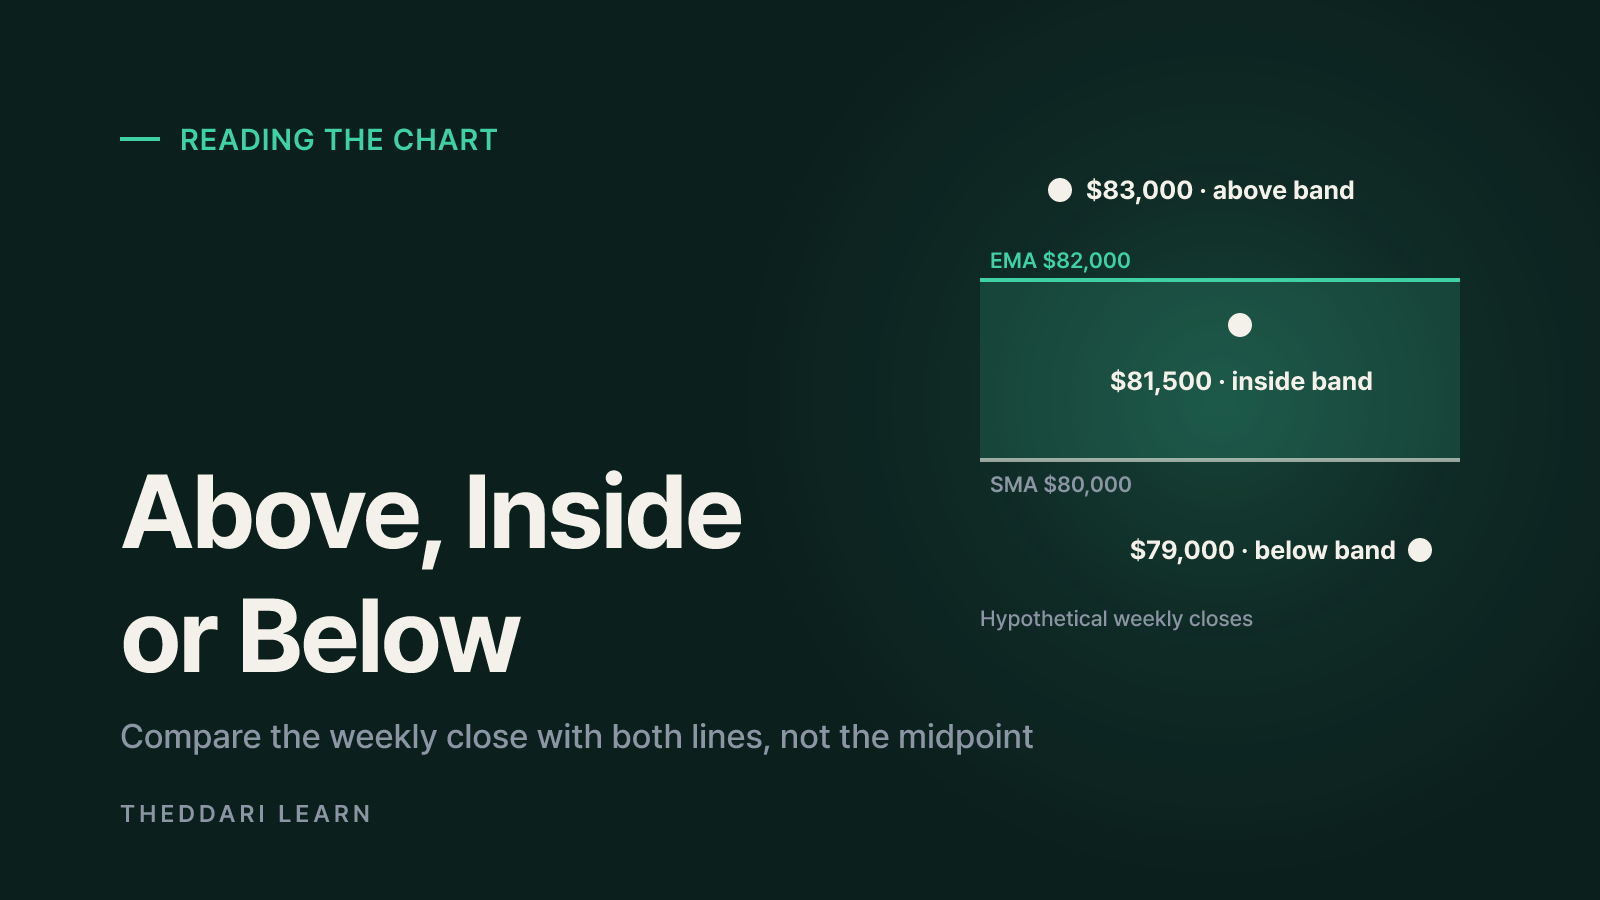
Start with the weekly close and compare it with both lines. Above both is above the band, between them is inside, and below both is below. Alphabit uses a hypothetical example: with the SMA at $80,000 and the EMA at $82,000, a weekly close of $83,000 is above the band, $81,500 is inside it, and $79,000 is below it. Being above the $81,000 midpoint does not mean price has cleared the band; you need to check both boundaries.
- Wick versus close. A dip below the band during the week that recovers by the weekly close is not a weekly break.
- Price break versus crossover. Price closing below both averages is not the same as the 21-week EMA crossing below the 20-week SMA. Price can lose the band well before the averages change order.
- Slope and duration. Whether both averages are rising or falling, and how many weeks a break or reclaim lasts, carries more information than a single week's position.
- Distance. The ratio of price to the band shows how stretched a move is, but no ratio reliably marks where a pullback will stop.
A real reading from October 2026
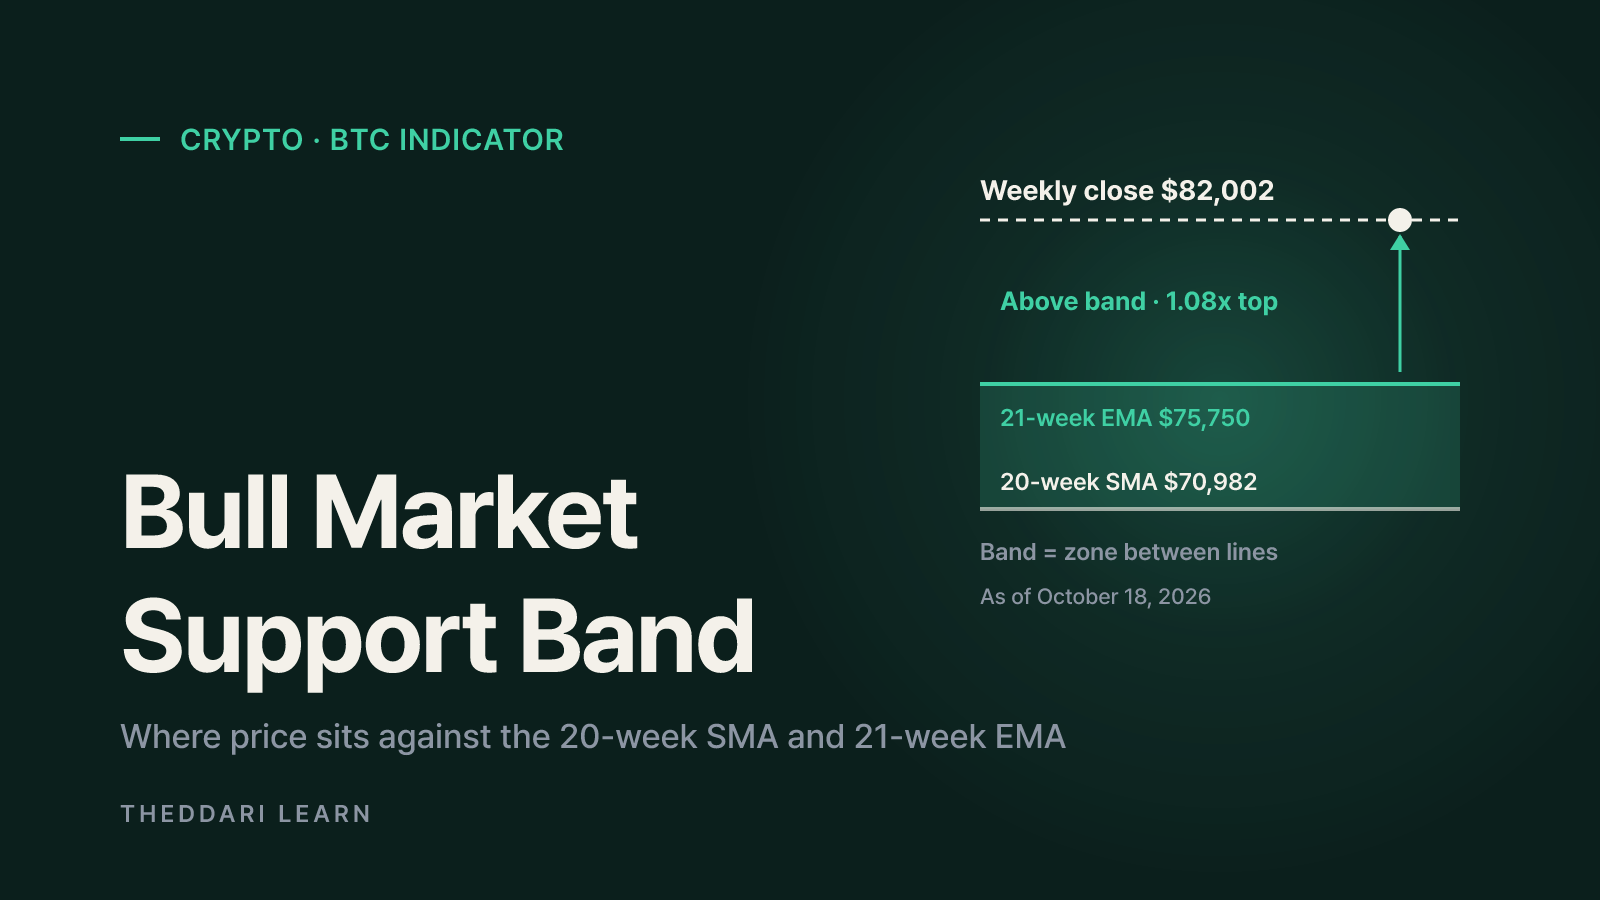
BTChub's indicator page recorded a Bitcoin close of $82,002 on October 18, 2026, with the 20-week SMA at $70,982 and the 21-week EMA at $75,750. The EMA was the upper edge, and price stood about 1.08 times that level. By the strict definition, price was above the band because it closed above both lines. Yet BTChub's own legend labels anything from 0.90x to 1.10x as at the band. Labels like this are a site's convention, so always check the underlying numbers against the definition. These values change every week as new closes enter the averages.
If you follow Bitcoin in Korean won on domestic exchanges, remember that the won price includes the exchange rate and any local premium, so a band calculated on a KRW chart can differ from the USD version. The theddari kimchi premium tracker shows that gap between Korean and overseas prices.

How the band behaved in past bull and bear markets
The band's reputation comes largely from the 2017 bull run. zkdev's script notes that Bitcoin went through several 30-40% corrections that came down to the band, with price either bouncing off it or riding above it until the end of the cycle. Since then, many analysts have used the band to gauge where deep bull-market pullbacks might find buyers.
In bear markets the picture changes. BTChub describes the band as meaningful only inside a bull market, acting as a ceiling rather than a floor in a downtrend, and whipsawing at transitions. It also notes the indicator has been widely watched only since around 2017, which gives roughly two full cycles of evidence. A small number of cycles makes it risky to treat any historical pattern as a law.
Bull market
- Typical band behavior
- Pullbacks reach the band, then price recovers
- Caveat
- Past bounces do not ensure the next one
Bear market
- Typical band behavior
- Rallies stall near the band from below
- Caveat
- A break above can still mark a trend change
Transition or range
- Typical band behavior
- Price and averages tangle and cross often
- Caveat
- Signals flip within a few weeks
Leverage in perpetual futures can amplify moves around widely watched levels. Checking whether funding rates were heavily one-sided when price approached the band adds positioning context that a price-only chart cannot provide. The theddari funding rate comparison lets you see those rates across exchanges.
Limits of the bull market support band
It lags. Moving averages are built from past prices, so they confirm a trend change only after it happens. Even the faster EMA uses about five months of data. Alphabit points out that the band does not measure holder cost basis, liquidity, or the probability of loss. Because it is price-only, agreement with other price-based indicators is not independent confirmation.
It whipsaws. In sideways markets price crosses the band repeatedly. Alphabit only marks an EMA/SMA crossover after the new order holds for at least three weeks and warns that treating the first marked week as a signal known at the time uses future information. Hindsight makes historical crossovers look cleaner than they were in real time.
Backtests are underwhelming. Tickfloor tested a daily proxy rule, holding only while price was above both a 140-day SMA and a 147-day EMA, on 18 crypto pairs including BTC from January 12, 2018 to March 14, 2025. Across 772 trades and after costs, it beat an equal-weight benchmark by 2.3 percentage points a year, but with a p-value of 0.466 the difference was not statistically significant. The test did not use true weekly bars or Bitcoin alone, so it does not prove the band is useless; it does suggest a simple rule built on it is unlikely to deliver a reliable edge.
Frequent past bounces near the band are observations, not evidence that the next pullback will hold there. Using the band as the only stop level on a leveraged position can expose you to intraweek volatility and gaps larger than expected.
A practical checklist for reading the indicator
- 1
Standardize the inputs
Use a weekly chart, completed weekly closes, and note the data source and currency. Do not compare a USD band with a KRW chart.
- 2
Classify the position by definition
Compare the weekly close with both the 20-week SMA and the 21-week EMA. Decide whether price is above, inside, or below the band rather than relying on a midpoint or a site's label.
- 3
Track the crossover and slope separately
Record which average is on top, whether both are rising or falling, and how many weeks any change in order has persisted.
- 4
Add non-price context
Look at volume, funding rates, scheduled macro events, and market attention. Several indicators built on the same price series pointing the same way are not independent evidence.
- 5
Write your rules in advance
Decide what you will re-check if the band position changes and how much loss you can tolerate. The indicator should inform that plan, not replace it.
Social attention can be another data point. The theddari crypto Telegram trends page shows which keywords are being discussed most, which helps you judge whether a band break is getting unusual attention. Treat it as context, not as a directional signal.
In short, the bull market support band is a quick way to see whether Bitcoin is trading above or below its roughly five-month trend, and it matters partly because so many market participants watch it. Keep its weaknesses in view: it lags, it whipsaws in ranges, it rests on about two cycles of evidence, and simple rules based on it have not shown a statistically significant edge. Use it as a map of where price stands, not as a signal of where it goes next.