Contents8 sections
- What is the bitcoin 50-week moving average?
- Past bitcoin 50-week moving average breaks and what followed
- What is different about the November 2026 break
- 50-week vs 20-week and 200-week moving averages
- What to check alongside the 50-week line
- Limits of relying on one indicator
- Frequently asked questions
- Sources and references
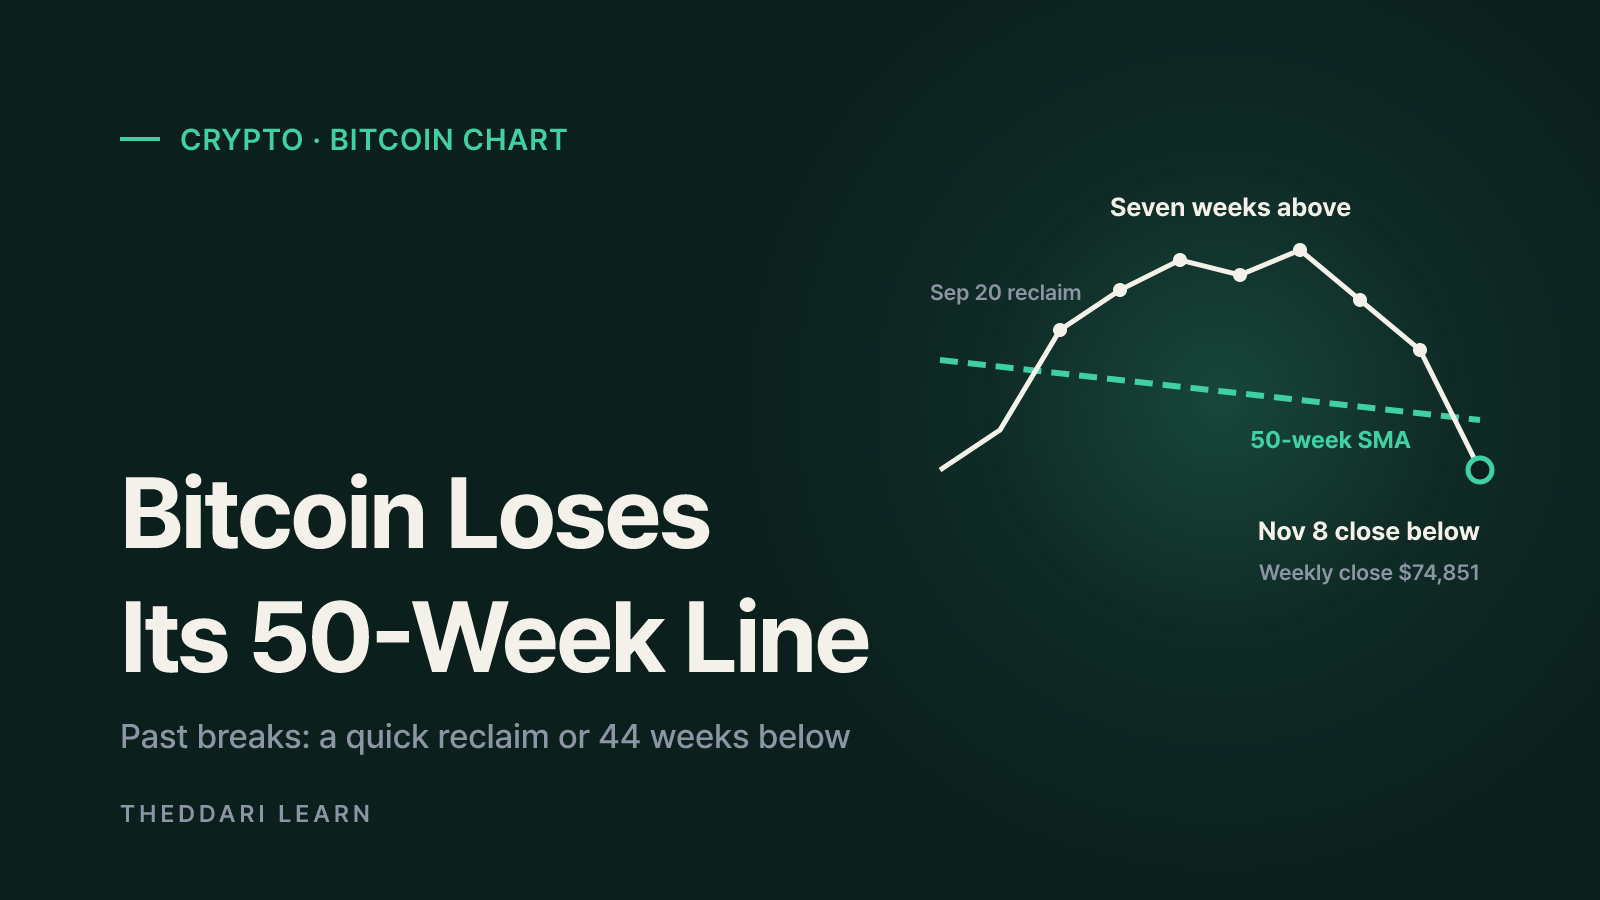
A weekly close below the bitcoin 50-week moving average means the price has finished a week under its average level of roughly the past year. Traders treat that as a sign the long-term trend has weakened, but past breaks have ended in everything from a one-week shakeout to a months-long slide, so the line alone does not tell you which one you are in. As of November 12, 2026, bitcoin had closed the week of November 8 (UTC) at $74,851, below its 50-week simple moving average. This guide explains how the line is calculated, what happened after earlier breaks, what is different this time and which data to check alongside it.
What is the bitcoin 50-week moving average?
The 50-week simple moving average (SMA) adds up the last 50 weekly closing prices and divides by 50. Each Sunday a new close enters and the close from a year earlier drops out, so the line moves slowly and tracks about a year of price history. 99Bitcoins, via Yahoo Finance, describes it simply as the average of the last 50 weekly closes. Many bitcoin analysts use it as a rough dividing line between bull and bear market conditions.
Definitions matter. An intraday wick below the line is not the same as a weekly close below it. Most analysis uses the weekly close at midnight UTC on Sunday, which is 7 p.m. Eastern on Sunday in winter. Counting every intraday dip as a break would generate far more false signals.
Why the number differs between charts
Your 50-week line depends on your data. At the November 8 close, Base Camp calculated the SMA at $75,535 using Binance BTC/USDT, while Galaxy's figure cited by The Block was $75,488. The 50-week exponential moving average (EMA), which gives recent weeks more weight, stood higher at $78,432. When a video or post says bitcoin lost the 50-week line, check which feed and which type of average it uses.
Past bitcoin 50-week moving average breaks and what followed
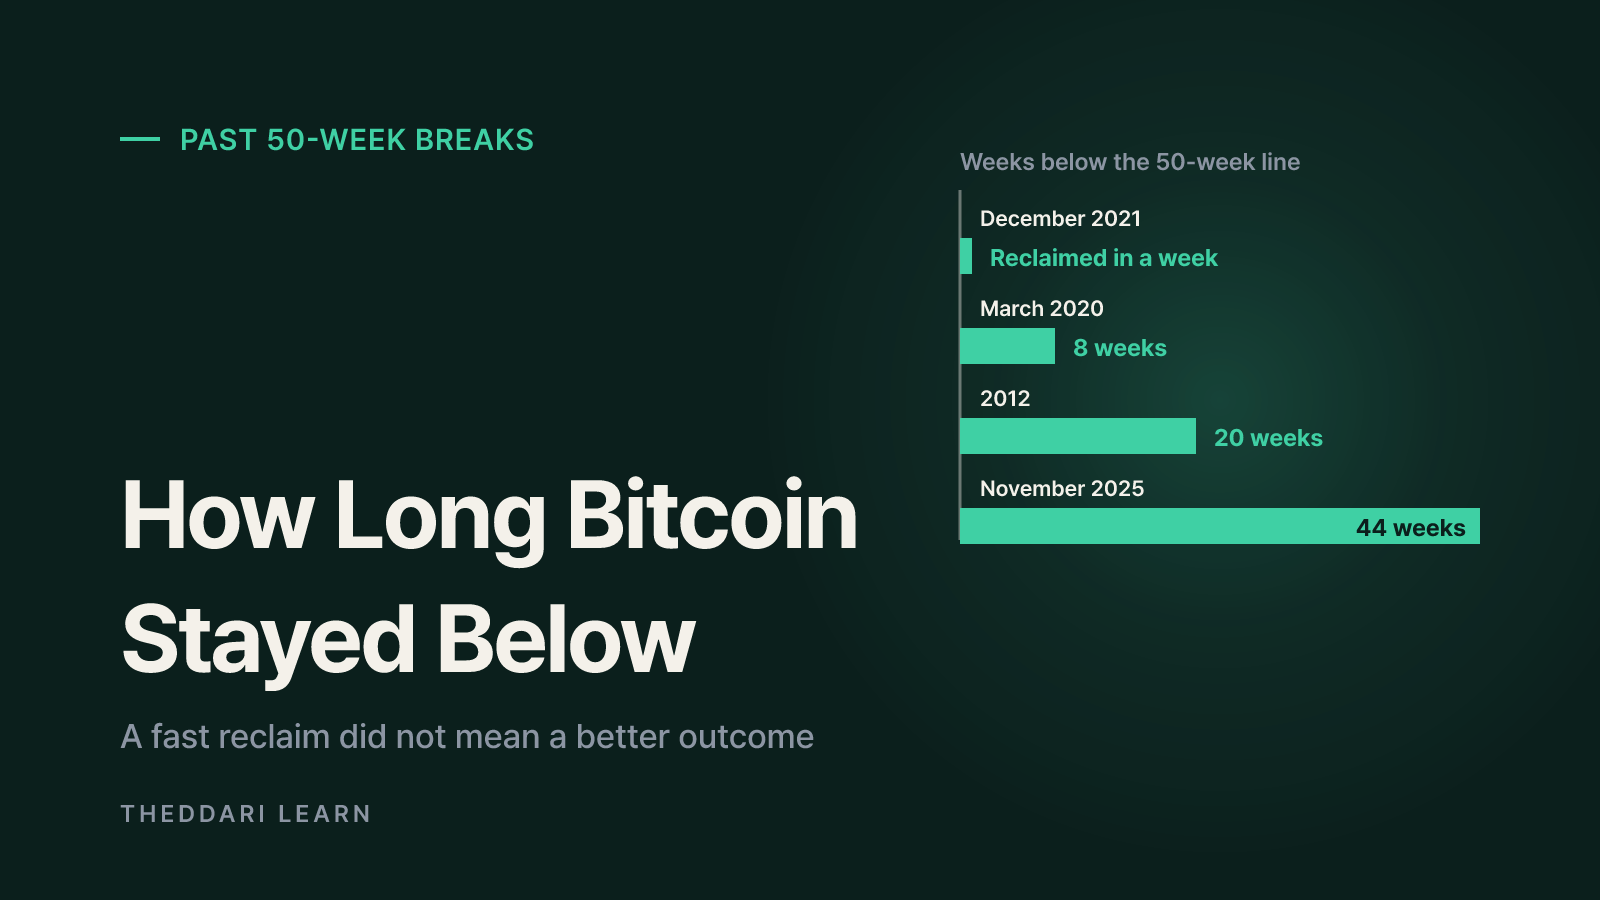
Earlier breaks split into two groups. When bitcoin lost the line after it had already bottomed and recovered, the prior low tended to hold. When the break came before the bear market low, losses deepened. The catch is that you only know which group you were in after the fact.
2012
- After the break
- 20 weeks below the line, weekly closes up to 35% beneath it
- Outcome
- Prior bear low held on a weekly-close basis; then 2+ years above
Nov 2019 to Jan 2020
- After the break
- Four closes below, each reclaimed within two weeks
- Outcome
- Trend intact
March 2020 (Covid crash)
- After the break
- Eight weeks below; weekly close fell to $5,361
- Outcome
- Still 66% above the 2018 low; new all-time high by year end
December 2021
- After the break
- Reclaimed in one week
- Outcome
- Bear market to a $16,280 weekly close in November 2022
November 2025
- After the break
- Lost at $94,261 after 139 weeks above
- Outcome
- 44 weeks before a weekly close back above
The table draws on Base Camp's review of Binance weekly data and BMTV analyst Sean Hagan's comparison reported by TokenPost. Base Camp found five earlier cases since August 2017 where bitcoin lost the line after at least seven weekly closes above it. Three were back above within a week, yet returns 12 weeks later ranged from +43.7% to -25.4%. Speed of recovery was not a reliable guide: December 2021 was among the quickest reclaims and had the worst outcome.
The "after the bottom" condition
Galaxy research head Alex Thorn counts five reclaims of the 50-week line after a bear market low since 2011: 2012, 2015, 2019, 2023 and September 2026. According to CoinDesk, his work found that in four of the five previously completed bear markets, the first weekly close above the 50-week SMA led to a bull run; the exception was 2021-22, when two brief reclaims were followed by a deeper selloff. Thorn himself noted the sample is only five reclaims and that a bottom is known only in hindsight.
What is different about the November 2026 break
Bitcoin reclaimed its 50-week line with an $81,178 weekly close on September 20, 2026, and held above it for seven straight weeks. The November 8 close of $74,851 ended that streak and marked a fifth consecutive red weekly candle. The cycle low was a $59,517 weekly close on June 28 by Galaxy's data, so the latest close still sat about 26% above it. Late on Sunday, bitcoin briefly hit $73,510 on Binance.
- Crypto liquidations topped $1.15 billion in 24 hours, including $1.04 billion of long positions, The Block reported citing CoinGlass.
- U.S. spot bitcoin ETFs saw $1.28 billion in net outflows from November 2 to 6, and the 12 funds turned negative for 2026 with $914.1 million in net outflows year to date.
- By November 12, CoinDesk reported bitcoin trading below $73,400 against a 50-week SMA of $75,153. Market maker Wintermute said it would stay cautious below the average, naming $68,000 as the next level down and a reclaim of $80,000 as what would change its view.
Hagan also flagged a key difference. The 50-week average now sits just 29% above the June low, whereas bitcoin was 200% and 169% above its prior bear market lows when it lost the line in 2012 and 2020. A thinner cushion makes the "prior low holds" pattern less certain. On the other side, the average itself is falling about $300 a week as high prices from late 2025 roll out of the calculation, so even sideways trading narrows the gap.
50-week vs 20-week and 200-week moving averages
Longer averages react more slowly, so the same drop reads differently depending on the line you watch. The bull market support band, built from the 20-week SMA and 21-week EMA, responds faster and is usually the first to be lost in a correction.
20-week line / bull market support band
- Approx. lookback
- ~5 months
- Common use
- Is a bull market correction getting deeper?
- Main weakness
- Frequent breaks and reclaims
50-week line
- Approx. lookback
- ~1 year
- Common use
- Bull vs bear regime filter
- Main weakness
- Lags; confirms turns late
200-week line
- Approx. lookback
- ~4 years
- Common use
- Historical long-term floor zone
- Main weakness
- Too slow for near-term decisions
Base Camp put the 200-week moving average near $68,000 at the November 8 close, close to the level Wintermute named. Overlapping lines can attract attention, but they do not guarantee a bounce. Moving averages summarize past prices; actual order flow and capital movement decide where price goes next.
What to check alongside the 50-week line
A moving average tells you what happened, not why. In this break, ETF outflows and a long liquidation cascade arrived at the same time. Working through the checks below reduces the risk of leaning on one line.
- 1
Confirm the weekly close
Note whether the break is intraday or on the weekly close, and which exchange and SMA or EMA you are using. Count consecutive weeks below the line so you can tell a 2019-style blip from a 2025-style extended stay.
- 2
Track spot ETF flows
Watch whether net outflows from U.S. spot bitcoin ETFs persist. Sustained redemptions mean funds are selling bitcoin, which can slow any recovery.
- 3
Read leverage and liquidations
Look at liquidation totals, open interest and funding rates together. If long liquidations are followed by lower funding and shrinking open interest, some excess leverage may have been cleared.
- 4
Compare regional pricing
Price gaps between exchanges and regions, such as the Korean premium, can show whether retail demand in specific markets is cooling or holding up.
You can compare funding rates across venues and check the Korean premium with these theddari tools. They show current market conditions; they do not forecast the next move.

To see which stories crypto communities are reacting to, the Telegram crypto trends page collects channel activity. Treat it as context and verify any claim against primary data.
Limits of relying on one indicator
First, the sample is tiny. With roughly five comparable breaks in bitcoin's history, any "historical probability" is fragile. Second, the indicator lags by design: it averages a year of prices, so it confirms trend changes after they have begun. Third, the market has changed. There were no spot ETFs in 2012 or 2020 and derivatives markets were far smaller, so similar signals can play out differently now.
Fourth, widely watched levels can become self-fulfilling for a short time. Stop orders and liquidation prices cluster around them, which can amplify a break and then produce a sharp snapback. A more practical reading of a 50-week break is "the trend has weakened, so recheck flows and leverage" rather than a mechanical sell trigger. Deciding your time horizon and the loss you can tolerate before a signal appears makes it easier to respond calmly.
In short, the November 2026 close below the 50-week moving average undercut September's bullish reclaim, but earlier breaks led to outcomes ranging from a brief wobble to nearly a year of weakness. Tracking whether weekly closes return above the line over the coming weeks, whether ETF outflows ease and how much leverage is flushed will give you better evidence than the line alone.