Contents7 sections
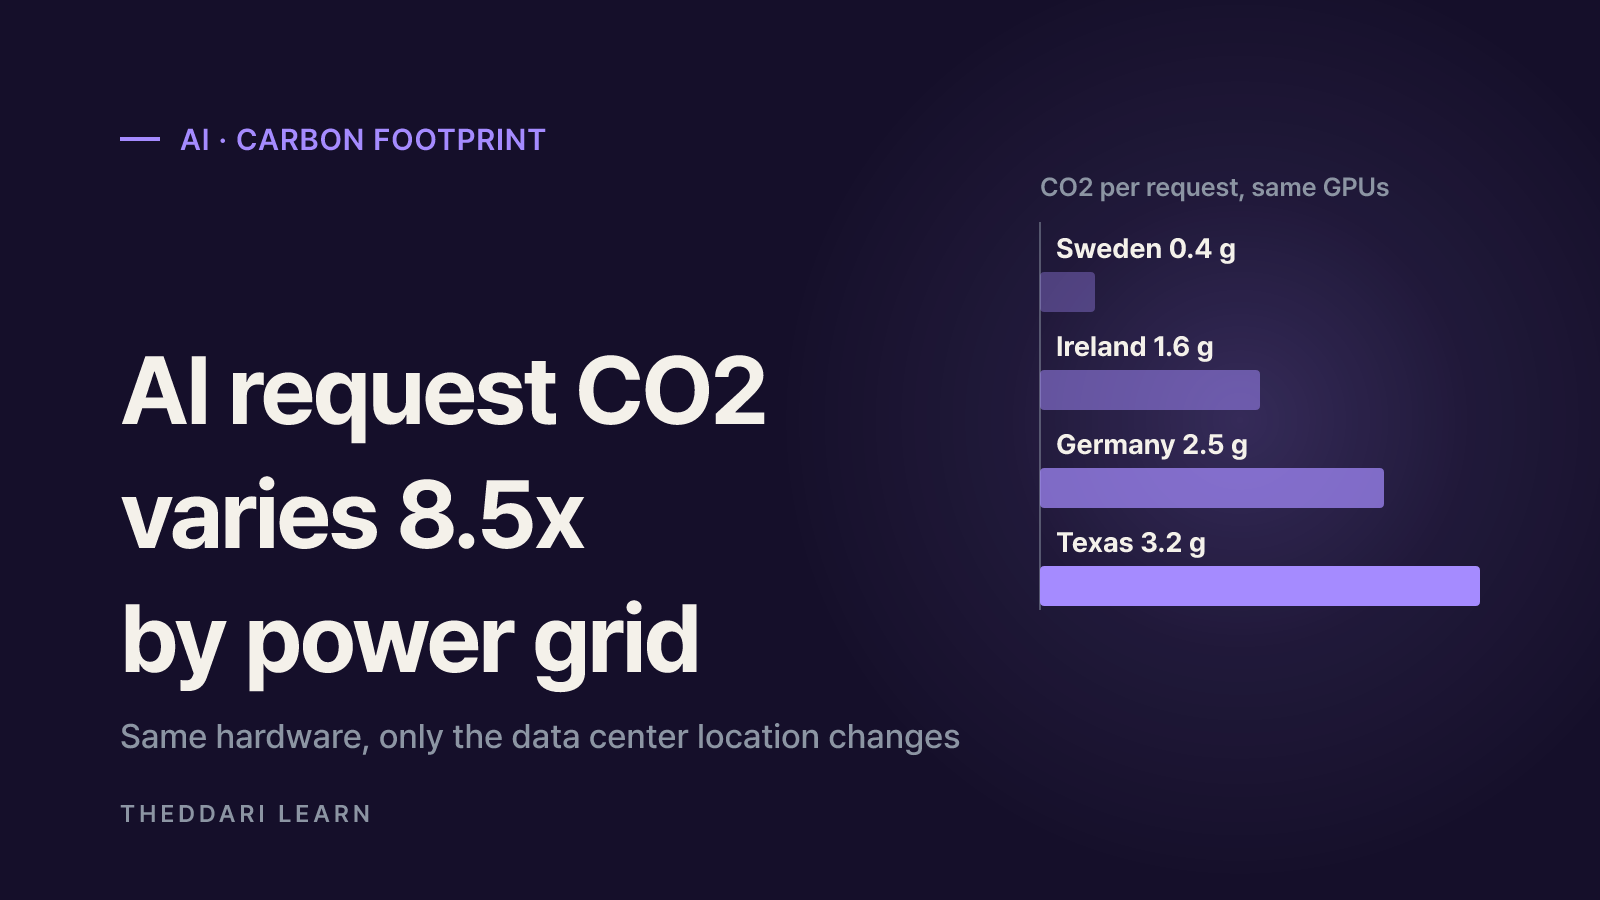
AI carbon emissions per request depend less on what you ask and more on where the server answering you draws its electricity. On October 21, 2026, Swedish inference provider Berget AI published an open-source method for estimating the CO2 of each request. Its headline example: one typical request to the open model Kimi K3 emits about 0.4 g of CO2 in Sweden and 3.2 g in Texas, an 8.5x difference on identical hardware. This guide, current as of October 2026, explains what drives that gap and which assumptions you should check before quoting any per-prompt figure.
How big are AI carbon emissions per request?
The Berget AI release was developed with the Stockholm Environment Institute (SEI) and the nonprofits WattTime and Klimatkollen. The example request is a production-typical prompt of 5,000 input tokens and 387 output tokens, served on a shared NVIDIA B300 node. Emissions are location-based, meaning they use the average carbon intensity of the regional grid, and they include the carbon from manufacturing the hardware. Model training is excluded.
Sweden
- CO2 per Kimi K3 request
- about 0.4 g (0.38 g)
- Grid intensity (g CO2e/kWh)
- about 8
- Grid data source
- IEA 2024
Ireland
- CO2 per Kimi K3 request
- 1.6 g
- Grid intensity (g CO2e/kWh)
- about 224
- Grid data source
- SEAI 2024
Germany
- CO2 per Kimi K3 request
- 2.5 g
- Grid intensity (g CO2e/kWh)
- about 337
- Grid data source
- Ember 2024
Texas (ERCOT)
- CO2 per Kimi K3 request
- 3.2 g
- Grid intensity (g CO2e/kWh)
- about 333
- Grid data source
- EPA eGRID 2023
For context, the same fact sheet puts the global average grid at about 470 g CO2e/kWh. These are modeled estimates built on Berget's own infrastructure and published emission factors, not metered readings from data centers in each region. The release also carries a correction: an embargoed draft listed 1.2 g for Ireland, 2.1 g for Germany, 3.9 g for Texas and a tenfold gap, before a source review revised the grid factors. That is a useful reminder of how sensitive these numbers are to a single input.
Why the same AI request varies 8.5x by location
Roughly, per-request carbon equals energy used × grid carbon intensity × data center overhead (PUE), plus a share of the hardware's manufacturing emissions. Each term behaves differently across regions.
Grid carbon intensity
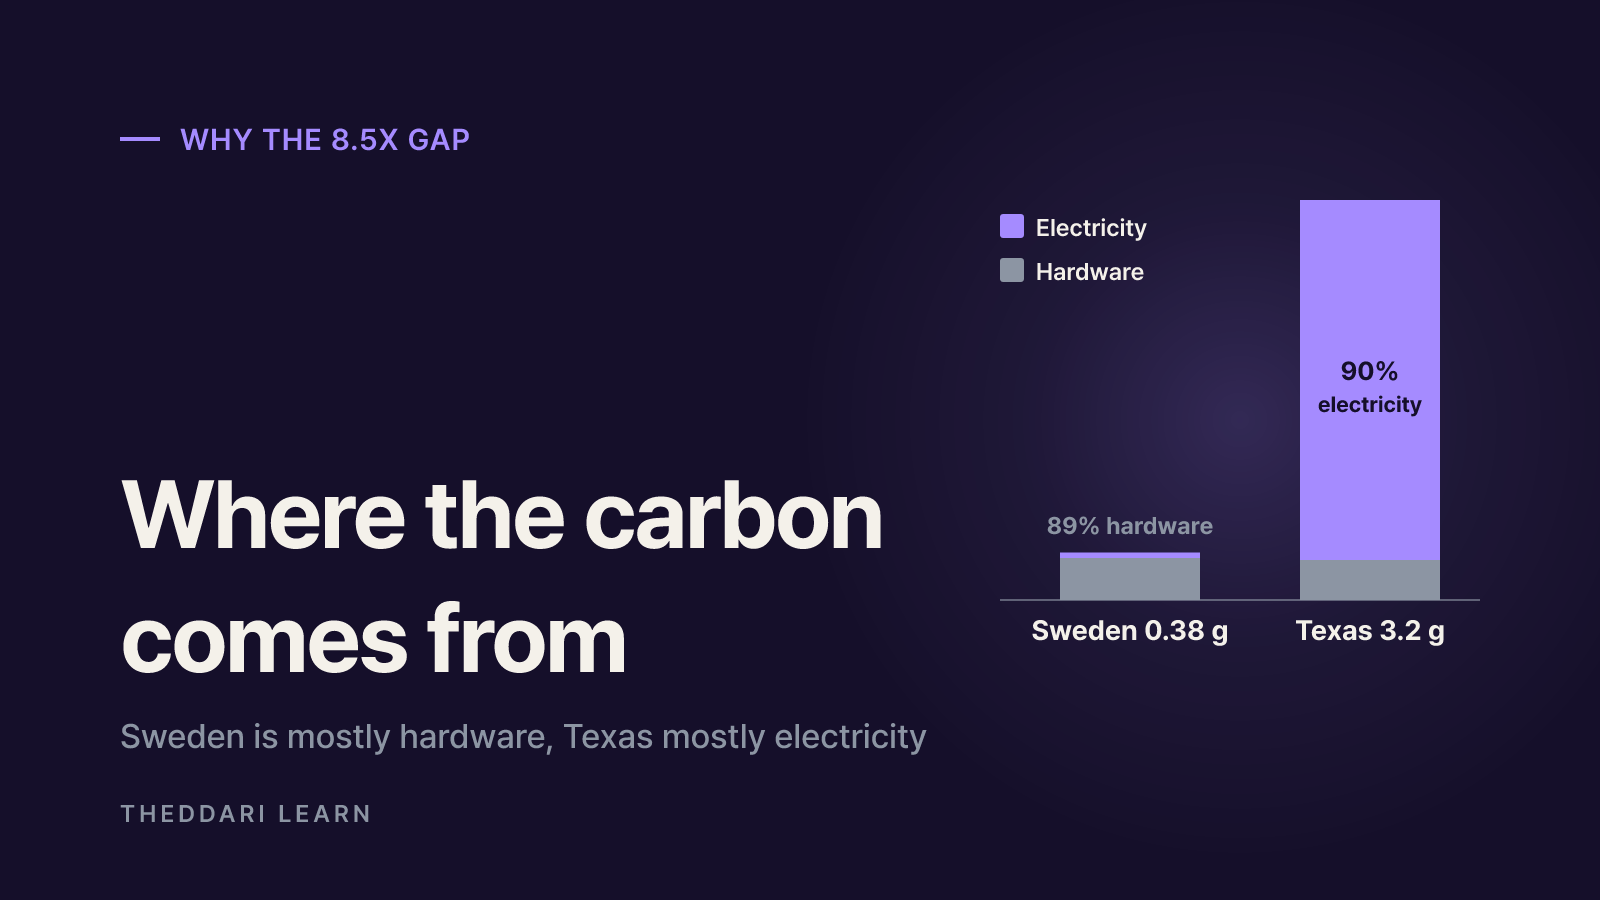
This is the biggest lever. Sweden's hydro- and nuclear-heavy grid sits around 8 g CO2e/kWh, while the Texas ERCOT grid, with a large share of gas and coal, sits around 333 g. That is more than a 40-fold difference in the emissions attached to each kilowatt-hour. In Berget's breakdown, 90% of the 3.2 g Texas figure comes from electricity.
Climate and cooling overhead
Power usage effectiveness (PUE) is total facility power divided by IT power, so it captures cooling and power conversion losses. Berget says Nordic free-air cooling runs at a PUE of about 1.15 with no water, while hot climates push toward 1.8 and can use up to 2 liters of water per kWh. The calculator's defaults on GitHub assign Germany 1.35 and Texas 1.80. That explains why two grids with nearly identical intensity produce 2.5 g and 3.2 g per request. The Texas request also carries about 6 mL of cooling water.
Embodied hardware emissions
Building GPUs emits carbon too. Berget assumes about 1,000 kg of CO2 per data center GPU, amortized over a five-year life. That share is the same wherever the chip sits, so on Sweden's clean grid it dominates: 89% of the 0.38 g figure is manufacturing. Compare operational emissions alone and the regional gap widens sharply. In the calculator's Gemma 4 31B example, operational emissions are about 56.7x lower in Sweden than the US average, but the total gap shrinks to about 7.2x once embodied carbon is added.
Idle power is another variable. Berget measured an idle B300 drawing 236 W over seven days in production. The lower a server's utilization, the more standby energy each request has to carry.
Why Google's 0.03 g Gemini figure is not comparable
In August 2025, Google reported that the median Gemini Apps text prompt, measured on May 2025 data, used 0.24 Wh of energy, emitted 0.03 g CO2e and consumed 0.26 mL of water. That looks smaller than even Berget's Swedish figure, but the two numbers measure different things.
Request
- Berget AI (Kimi K3)
- Typical prompt with 5,000 input and 387 output tokens
- Google (Gemini Apps)
- Median text prompt
Model
- Berget AI (Kimi K3)
- 2.8T-parameter mixture-of-experts open model
- Google (Gemini Apps)
- Model serving the median prompt across Gemini models
Grid factor
- Berget AI (Kimi K3)
- Regional average (location-based)
- Google (Gemini Apps)
- Google 2024 fleet average, market-based Scope 2
Hardware manufacturing
- Berget AI (Kimi K3)
- Included
- Google (Gemini Apps)
- Partly reflected in Scope 1+3
Verification
- Berget AI (Kimi K3)
- Method and code published under MIT
- Google (Gemini Apps)
- Not third-party verified, per Google
The key distinction is location-based versus market-based accounting. Location-based figures use the average intensity of the grid a server is plugged into. Market-based figures can reflect a company's clean energy purchases, which lowers the factor. In Google's paper, 0.023 g of the 0.03 g is market-based Scope 2. Google also shows that a narrower boundary counting only active accelerators drops energy to 0.10 Wh, a 2.4x gap from measurement scope alone. Before comparing numbers, match token length, model size, accounting method and boundary.
Limits of per-request CO2 estimates
- Average versus marginal rates: Berget uses average grid intensity, the norm in greenhouse gas accounting. It notes that marginal emission rates, which capture how extra load affects existing plants and new generation, may significantly change the results for Swedish data centers, and says it plans to add them to the calculator next month.
- Training excluded: Self-reported training figures vary by about plus or minus 50%, so they are left out by default. Including them could raise per-request totals.
- Embodied carbon uncertainty: GPU makers do not publish per-chip life-cycle assessments, so embodied estimates carry about 30 to 50% uncertainty. The water and energy footprint of chip fabrication is not yet covered.
- Request-level variation: Results change with the model, time of day and whether part of the prompt is cached, which is why the method calculates each request instead of multiplying an average.
- Provider perspective: Berget is a Swedish provider whose pitch is low-carbon inference. Publishing the method is a strength, but its defaults are its own infrastructure.
Scale matters as well. In the release, SEI's research director cites an International Energy Agency projection that data center electricity use will more than double to about 945 TWh by 2030, with AI as the main driver. A single request is small, but at volume the choice of grid shows up directly in total emissions. In fast-growing data center markets such as Texas, local air pollution from power plants and cooling water use are also part of the debate, separate from CO2.
How to reduce AI energy use and emissions in practice
According to Berget, open-weight models handled 29% of tokens on Vercel's AI Gateway in June 2026, up from about 11% in April. Because open models can run in any data center, visible emissions data gives buyers a real choice of location.
- 1
Check the serving region
Look at your API provider's region list and data processing location. If you can choose a region for the same model, compare the grid intensity of each option, while weighing latency and data residency requirements.
- 2
Ask how the number was calculated
If a provider shares carbon figures, ask whether they are location-based or market-based, whether hardware manufacturing and training are included, and which year's emission factors were used. Do not rank figures built on different methods.
- 3
Send fewer, leaner requests
More input tokens mean more compute. Trim unnecessary context, use prompt caching for repeated prefixes and pick the smallest model that handles the task well.
- 4
Experiment with an open calculator
Berget's calculator at co2.berget.ai and its GitHub code let you change model, region and hardware. Treat the output as an estimate and record the assumptions if you use it in reporting.
To follow how AI infrastructure and data center stories develop, you can browse theddari's curated AI Telegram channels and blog trends. When a new per-prompt figure appears, run it through the checklist above: model, tokens, grid factor, accounting method and scope.
 theddari.comTrendsBlog PostsSummarized Naver blog posts
In short, reported AI emissions per request range from a few hundredths of a gram to several grams, and much of that spread comes from assumptions about location, cooling, embodied hardware and accounting rather than from the prompt itself. Read the 8.5x figure as evidence that where inference runs matters, and read any single number together with the conditions behind it.