Contents8 sections
- What is an active ETF, and how is it managed?
- Expense ratios, trading costs and transparency compared
- Active vs passive ETF returns: what the data show
- Rules differ by market: South Korea's 0.7 correlation test
- Covered call active ETFs: income has a price
- How to evaluate an active ETF before buying
- Frequently asked questions
- Sources and references
An active ETF is an exchange-traded fund whose manager chooses what to buy and sell in pursuit of the fund's objective, usually to beat a benchmark, instead of copying an index. A passive ETF does the opposite: it holds the securities in an index such as the S&P 500 and aims to deliver close to the index return. Both trade on an exchange all day like a stock. The difference is who decides what goes in the portfolio, and that choice changes the fees you pay, how far results can stray from the market and which risks you take. This guide uses SEC, ICI, Morningstar and Schwab material checked in November 2026 and focuses mainly on US-listed funds.
The short answer: an active ETF is not automatically better or worse. You pay more for a manager's judgment and accept results that can differ, in either direction, from the market. Many popular income funds, including covered call ETFs, are active strategies that give up some upside in exchange for higher payouts.
What is an active ETF, and how is it managed?
The SEC's investor bulletin explains that ETFs can be index-based or actively managed. For an index-based ETF, the adviser seeks to track an underlying index and achieve returns that closely correspond to it. For an actively managed ETF, the adviser buys or sells holdings without regard to conformity with an index, as long as trades fit the fund's stated objective (SEC Investor.gov).
Passive (index) ETFs follow a rulebook
An index provider's methodology decides what a passive ETF owns. The fund holds every index member or a representative sample and rebalances when the index changes. Because there is little discretion and little trading, costs stay low. You judge a passive fund by tracking difference: how closely it matched the index after fees.
Active ETFs use the benchmark as a yardstick
An active ETF still names a benchmark, but only to measure results. The manager can overweight sectors they like, avoid ones they don't, hold cash or use options. You judge an active fund by excess return over its benchmark across several periods, and you should expect it to look different from the index; that is the point.
Expense ratios, trading costs and transparency compared
Goal
- Passive (index) ETF
- Match an index return
- Active ETF
- Beat a benchmark or meet an income or risk target
Who picks holdings
- Passive (index) ETF
- Index methodology
- Active ETF
- Portfolio manager
How to judge it
- Passive (index) ETF
- Low tracking difference
- Active ETF
- Excess return after fees
Average fee (US)
- Passive (index) ETF
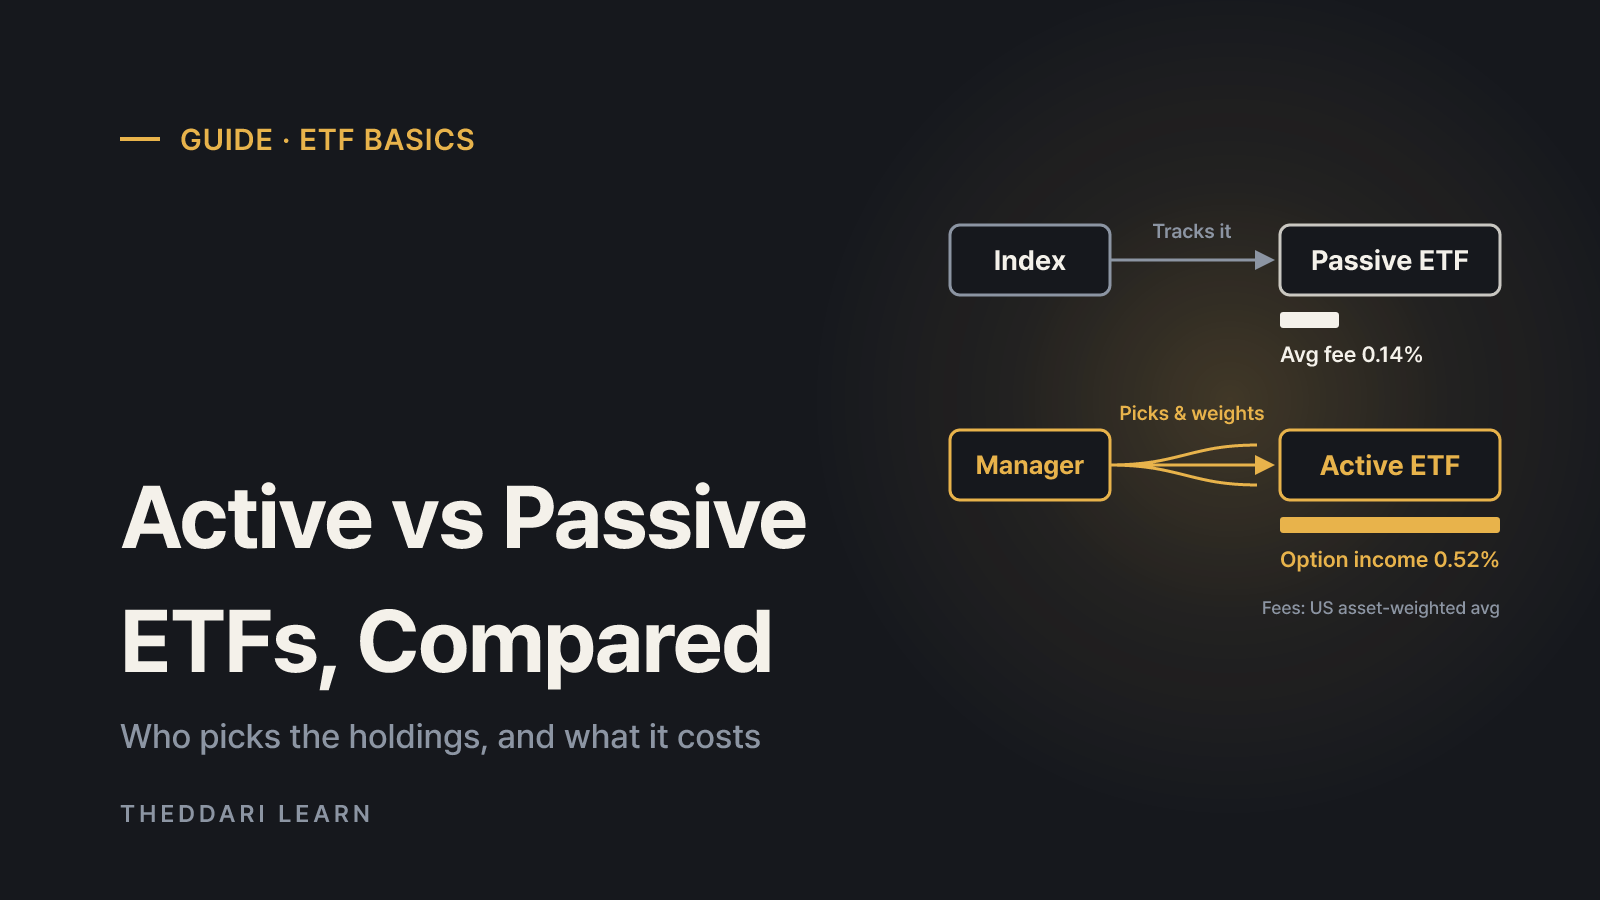
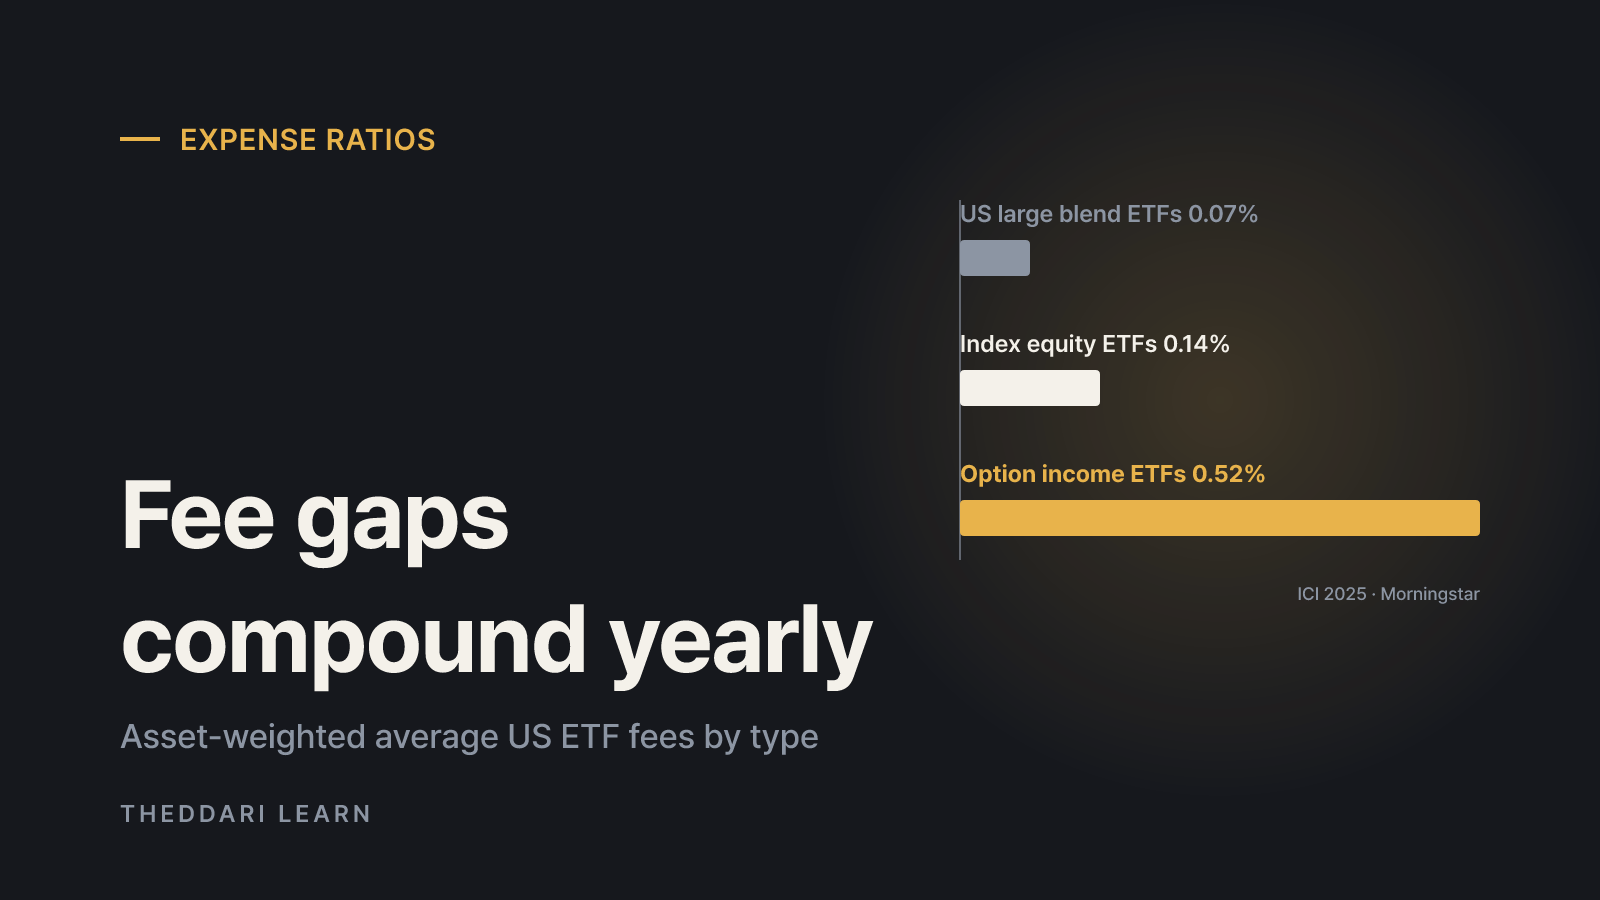
- 0.14% for index equity ETFs (ICI, 2025)
- Active ETF
- Wide range; 0.52% for derivative income ETFs
Turnover
- Passive (index) ETF
- Usually low
- Active ETF
- Usually higher
Spread of outcomes
- Passive (index) ETF
- Close to the index
- Active ETF
- Can beat or lag by a wide margin
Reading an ETF expense ratio
The Investment Company Institute reported in March 2026 that the asset-weighted average expense ratio for index equity ETFs held at 0.14% in 2025, and index bond ETFs fell one basis point to 0.09% (ICI). Asset-weighting means the cheapest giant funds pull the average down. Schwab, citing Morningstar, puts the asset-weighted average for the derivative income category, where most covered call ETFs sit, at 0.52%, versus 0.15% for US large value ETFs and 0.07% for US large blend ETFs (Schwab).
Fees compound against you every year, so an active ETF has to beat its benchmark by more than the fee gap just to break even with a cheap index fund. The SEC also flags hidden costs: the bid-ask spread you pay when trading and any premium or discount between the market price and net asset value (NAV). Funds with higher trading volume typically have tighter spreads.
Holdings disclosure
Most ETFs post their full holdings on their websites daily, according to the SEC bulletin. For an active ETF, comparing those holdings with the benchmark is the clearest way to see the manager's bets. If the top positions are concentrated in a handful of companies, their quarterly reports can move the fund, so it helps to track dates on the earnings calendar.

Active vs passive ETF returns: what the data show
Morningstar's mid-2026 US Active/Passive Barometer covered roughly 9,226 mutual funds and ETFs with about $29 trillion in assets, around 67% of the US fund market, as of June 30, 2026. Just over 40% of active funds survived and beat their average passive peer over the 12 months to June, up 7 percentage points from a year earlier. Across all categories, though, an investor picking an active manager at random faced a 60% probability of trailing the average passive peer (Morningstar).
- Category matters: active managers did relatively well in real estate, bonds and US small and mid-cap stocks, and poorly in US large-cap and foreign stocks.
- US large growth is hard: only 5% of active large-growth funds succeeded over 10 years, and the losers' shortfalls were much bigger than the winners' gains.
- Low fees help: in 16 of 20 categories, choosing from the cheapest fee quintile improved the odds of picking a winner.
- One year can mislead: market conditions swing short-term results, so compare three-, five- and ten-year records against the benchmark.
These figures blend mutual funds and ETFs, so they describe active management in general rather than the ETF wrapper. The wrapper itself mainly affects trading flexibility, transparency and, in US taxable accounts, tax efficiency.
Rules differ by market: South Korea's 0.7 correlation test
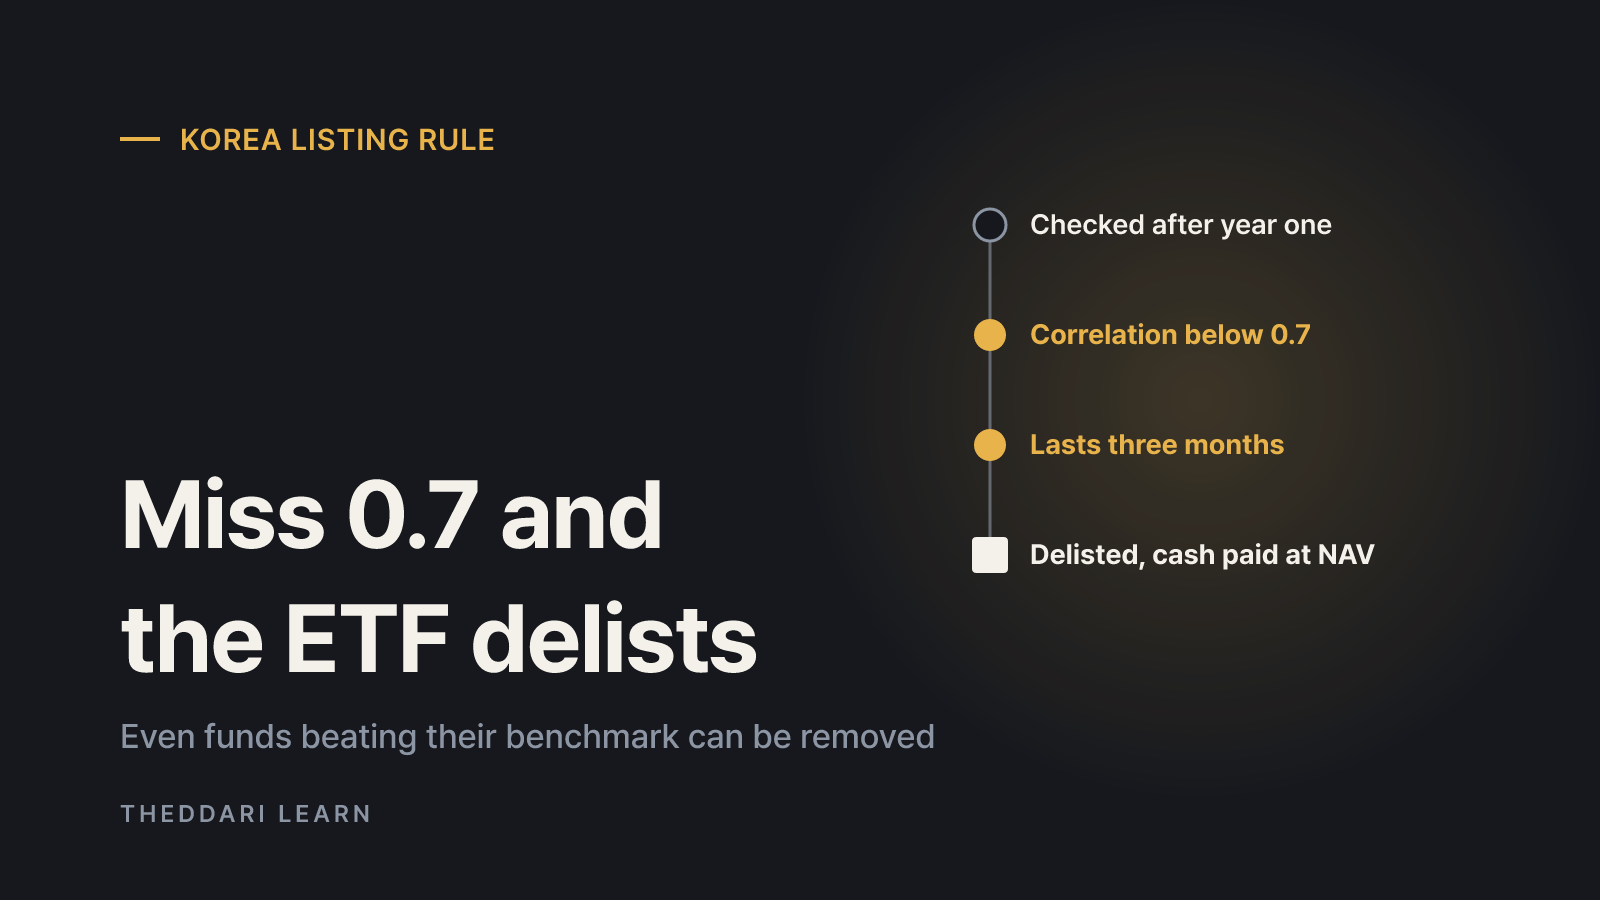
If you invest outside the US, check local rules. In South Korea, Article 116 of the KOSPI market listing rules requires an active ETF's daily NAV changes to keep a correlation of at least 0.7 with its benchmark's daily changes. If a fund listed for more than a year stays below that level for three months, it becomes subject to delisting. Major markets such as the US, Japan and Hong Kong do not apply a comparable requirement (Korea Financial Economy News).
The rule has teeth. According to the Korea Exchange, six active ETFs were delisted for missing it in the second half of 2026, including one physical AI fund on November 4 that had returned 35.11% over the prior year against -11.94% for its benchmark. Delisting does not wipe out holders: they receive cash based on NAV, but that can lock in a loss and force a reinvestment decision at a time they did not choose. Korean regulators said in January 2026 they would pursue fully active ETFs without the correlation limit, but that requires a law change that had not passed as of early November.
Covered call active ETFs: income has a price
Covered call ETFs own stocks and sell call options on them, passing the option premiums to investors with dividends. That boosts payouts, but any gain above the strike price goes to the option buyer. Schwab notes that these funds tend to do best in flat or modestly rising markets and lag when stocks rally quickly.
- Rallies: in 2024 the Dow Jones U.S. Dividend 100 index returned around 12%, while the S&P 500 Dividend Aristocrats Enhanced Covered Call index returned about 5%.
- Selloffs: in 2022 the plain dividend index lost 3% and the covered call index lost nearly 6%, so premiums did not act as a hedge.
- Costs: the 0.52% derivative income average is well above typical index equity ETF fees.
- Taxes (US): in taxable accounts, all or part of option income is often taxed at ordinary income rates rather than qualified dividend rates.
A high distribution rate is cash flow, not total return. If NAV falls while payouts stay high, you may be getting back part of your own capital.
How to evaluate an active ETF before buying
- 1
Read the objective and benchmark
Check the summary prospectus for the strategy, the benchmark and whether options or leverage are used.
- 2
Compare all-in costs
Put the expense ratio next to a comparable index ETF and note the gap the manager must overcome. Check median bid-ask spread and trading volume.
- 3
Compare holdings with the benchmark
Use the daily holdings file to see sector and stock bets, and how concentrated the top positions are.
- 4
Look at several time periods
Review returns since launch and over three, five and ten years where available, and ask whether strong results came from one theme.
- 5
Check market-specific rules and taxes
Confirm how distributions are taxed in your account type and whether local listing rules, like Korea's correlation test, add delisting risk.
Macro events such as central bank decisions move both active and passive funds. Use an economic calendar to know when volatility may rise, not as a tool to predict a fund's performance.
Bottom line: passive ETFs are a low-cost way to own the market, and active ETFs charge more for a manager's judgment and a different result. Before choosing active, make sure there is a clear reason to expect the fee gap to be earned, that the strategy fits your goal, and that you understand trade-offs such as capped upside in covered call funds.