Contents7 sections
The VXN is the Cboe Nasdaq-100 Volatility Index. It shows how much movement options traders expect from the Nasdaq-100 over the next 30 days, expressed as an annualized percentage. The VIX applies the same idea to S&P 500 options, so the core difference between the two is the underlying market: broad large caps for the VIX, a tech-heavy group of 100 Nasdaq-listed companies for the VXN. As of the November 12, 2026 close published on FRED, the VXN stood at 28.55 and the VIX at 18.70. When both jump at the same time, the level alone tells you little. The spread, the ratio and whether the move lasts more than a day carry most of the information.
What is the VXN and what does the number mean?
A volatility index does not measure how much the market has already moved. It measures how much movement is priced into options right now. As FINRA explains, the VIX is not based on actual daily price swings but reflects the expected volatility over the next 30 days implied by S&P 500 option prices. Cboe has long applied the same calculation to Nasdaq-100 index options to produce the VXN, which is why traders often call it the Nasdaq fear gauge.
The reading is an annualized standard deviation. A VXN of 28.55 means options are pricing Nasdaq-100 volatility at roughly 28.55% per year. To turn that into a rough one-month range, a common shortcut divides by the square root of 12, which is about 3.46. That puts the VXN's implied monthly move at about 8.2% and the VIX's at about 5.4% on November 12. These figures cover moves in either direction, and real outcomes regularly land outside them, so treat the conversion as a sense of scale rather than a forecast.
Why it is called a fear index
When stocks drop sharply, demand for protective put options rises, option prices climb and the index rises with them. Cboe notes that the VIX has historically had a strong inverse relationship with the S&P 500. The nickname is useful shorthand, but the index is a price, not a sentiment survey. Option supply and demand, scheduled events and interest rates all feed into it.
VIX vs VXN: key differences side by side
The methodology is shared; the underlying options are not. The Nasdaq-100 excludes financial companies, leans heavily on large technology and growth names, and is more concentrated at the top. The same news often moves it more than the S&P 500, and option prices reflect that. As a result, the VXN trades above the VIX on most days.
Underlying options
- VIX
- S&P 500 index options
- VXN
- Nasdaq-100 index options
Market covered
- VIX
- 500 large US companies
- VXN
- 100 large non-financial Nasdaq stocks
Sector mix
- VIX
- Broadly diversified
- VXN
- Tilted to tech and growth
Horizon
- VIX
- Next 30 days
- VXN
- Next 30 days
Close on Nov 12, 2026
- VIX
- 18.70
- VXN
- 28.55
Tradable products
- VIX
- Active VIX futures and options
- VXN
- Index not investable; few related products
On November 12 the VXN was 9.85 points above the VIX, about 1.53 times its level. A gap like that may be ordinary. What matters is change. A widening gap suggests the market sees more uncertainty in tech than in the broad market. A narrowing gap can mean fear has spread across sectors, or that tech-specific worry is fading first.
Cboe's VIX page showed a November 13, 2026 close of 19.30 and a 52-week range of 13.38 to 35.30. Placing today's reading inside a one-year range is a quick way to judge whether it is high or low for the current market. FRED charts let you do the same for the VXN.
How to read a joint VIX and VXN spike
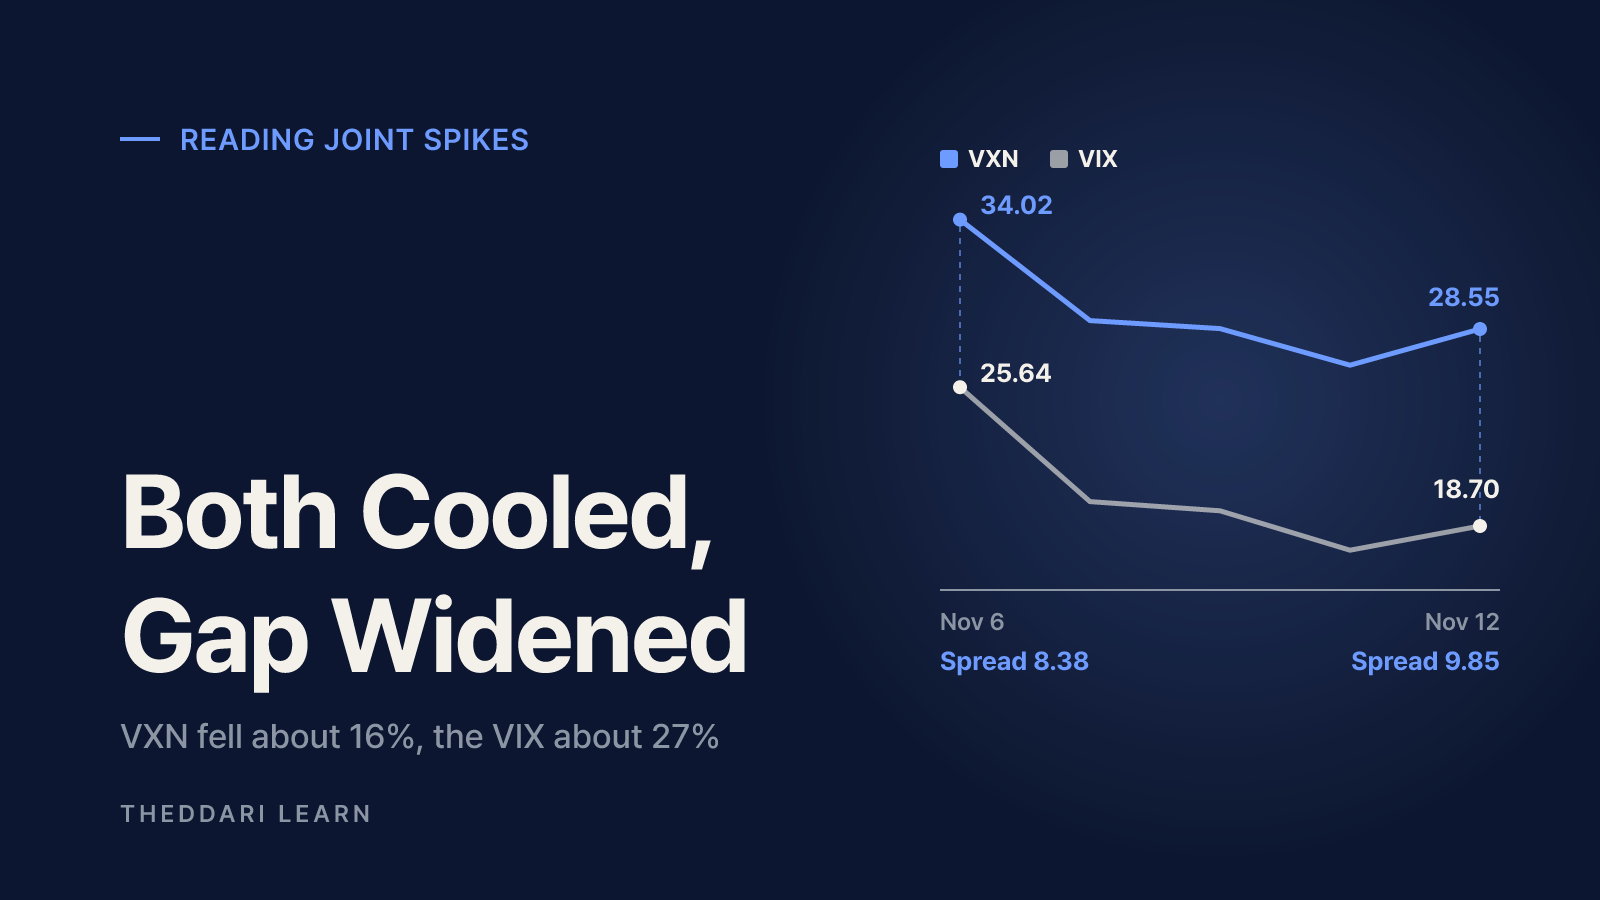
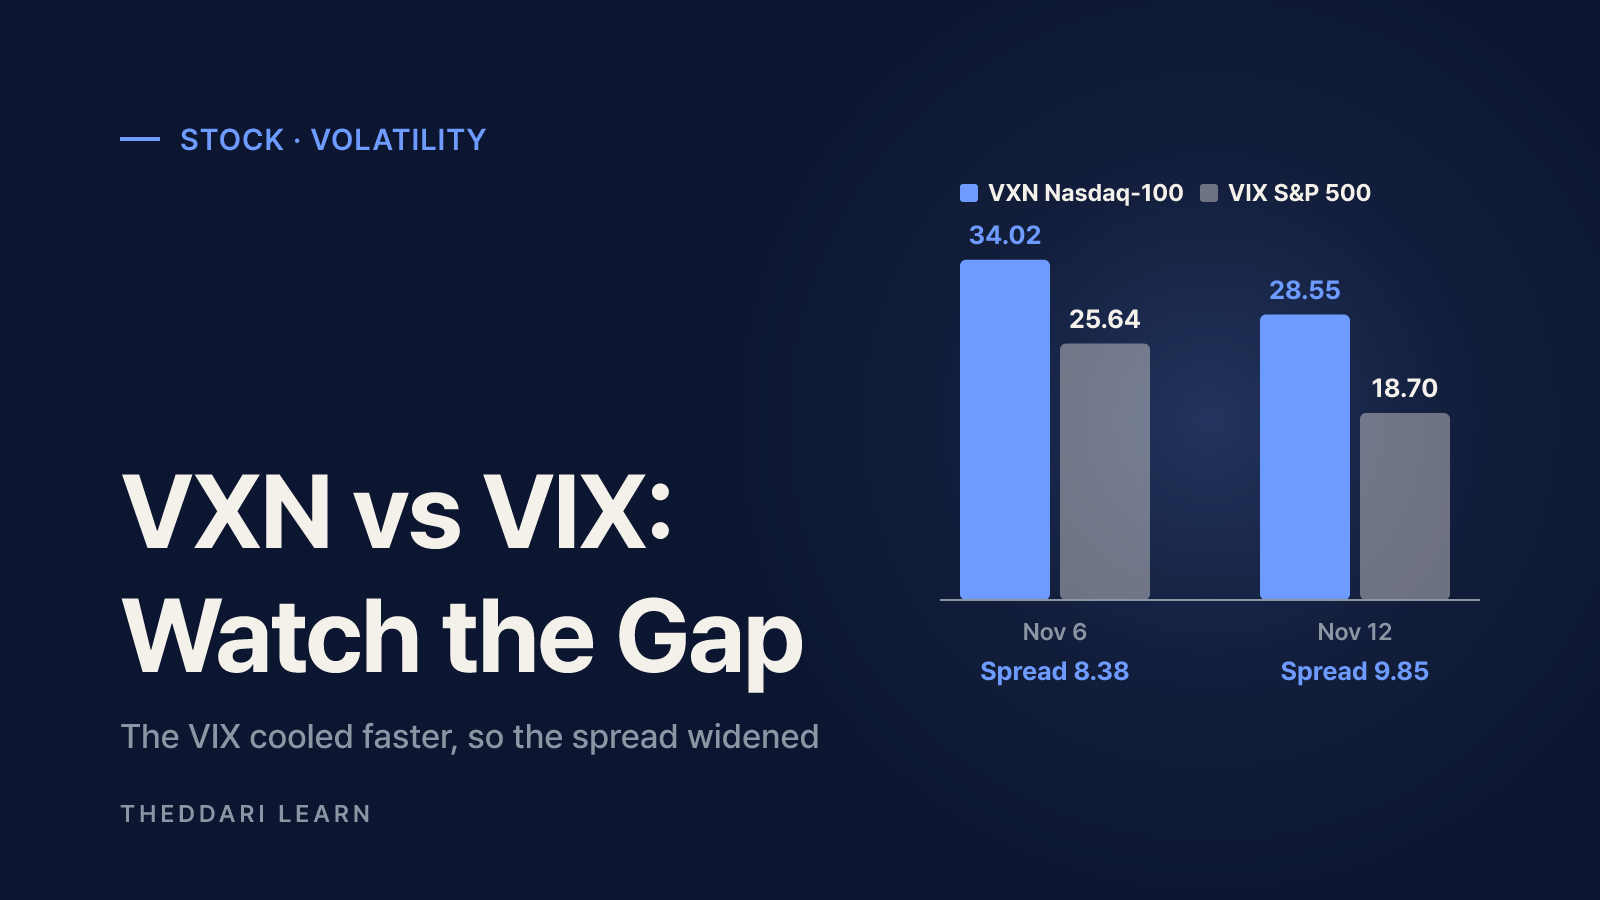
A recent example shows why the spread matters. On November 6, 2026, the VXN closed at 34.02 and the VIX at 25.64. By November 12 the VXN had eased about 16% to 28.55, while the VIX had dropped about 27% to 18.70. Both cooled, but the VIX cooled faster, so the gap actually widened from 8.38 to 9.85 points. One reasonable reading: broad-market anxiety unwound quickly while uncertainty around the Nasdaq-100 lingered.
Nov 6
- VXN
- 34.02
- VIX
- 25.64
- Spread
- 8.38
- Ratio
- about 1.33x
Nov 9
- VXN
- 28.97
- VIX
- 19.92
- Spread
- 9.05
- Ratio
- about 1.45x
Nov 10
- VXN
- 28.57
- VIX
- 19.46
- Spread
- 9.11
- Ratio
- about 1.47x
Nov 11
- VXN
- 26.74
- VIX
- 17.49
- Spread
- 9.25
- Ratio
- about 1.53x
Nov 12
- VXN
- 28.55
- VIX
- 18.70
- Spread
- 9.85
- Ratio
- about 1.53x
- 1
Place the level in context
Check where each index sits within its 52-week range. A jump from a calm base means something different from a further rise when readings are already elevated.
- 2
Track the spread and ratio
Record VXN minus VIX and VXN divided by VIX for several sessions. A widening spread points to tech-specific stress; a narrowing one suggests broad stress or tech calming first.
- 3
Check persistence
A one-day spike that reverses is not the same as several sessions at high levels. A run of closes tells you more than one print.
- 4
Look for the catalyst
Option prices often rise ahead of jobs and inflation reports, megacap tech earnings and policy decisions, then fall once the event passes.
- 5
Map it to your holdings
Estimate how much of your portfolio overlaps with the largest Nasdaq-100 companies. A relatively higher VXN is a prompt to review concentration, not a trading instruction.
The theddari economic calendar and earnings calendar list release dates and times in one place. They organize the schedule; they do not predict direction. Confirm important dates with the official publisher.

A volatility spike is not a crash signal
Searches for a stock market crash tend to surge alongside volatility headlines, but a high VIX or VXN shows how much uncertainty is already priced, not what comes next. Past spikes were followed by both rebounds and deeper declines, and averages built from a handful of extreme episodes are easily skewed. Interest rates, index composition and the options market itself have changed over time, which limits historical comparisons. Cboe also notes that implied volatility has tended to trade at a premium to the volatility that is later realized, so a high reading should not be assumed to play out in full.
Volatility ETPs do not track the index
Buying a volatility product after a spike is a common reflex. FINRA points out that the VIX itself is not investable and that most volatility-linked ETPs track VIX futures instead. Futures do not follow the index precisely, and their sensitivity weakens at longer maturities. FINRA adds that these products generally are not built for buy-and-hold use and can lose some or all of their value in a very short time, with leveraged, inverse and margin positions amplifying the damage. Read the entire prospectus before drawing conclusions from an index chart.
- The VXN and VIX price the size of moves, not their direction.
- A VXN above the VIX is normal; changes in the gap are the signal.
- The monthly conversion is an approximation, and actual moves can exceed it.
- Futures-based volatility ETPs can erode in value when held for long periods.
A simple routine for tracking Nasdaq volatility
Instead of watching ticks all day, fill in the same small table once a week or after major news. FRED's VXNCLS and VIXCLS pages publish daily closes for free. Five columns are enough: date, VXN, VIX, spread and ratio. Note that FRED updates with the prior session's close and that data can be revised.
To see which stock stories investors are reacting to, the theddari Telegram stock trends page offers a quick read on attention. Treat it as a gauge of interest, not as evidence, and verify any numbers at the original source.
In short, the VXN is the market's price tag on Nasdaq-100 uncertainty, and it becomes most informative when compared with the VIX. Rather than reacting to the fact that both indexes jumped, check where the levels sit in their one-year range, how the spread and ratio changed, which event drove the move and how concentrated your own holdings are in large tech stocks.