Contents7 sections
The Nasdaq selloff of Thursday, November 5, 2026 was less about the election itself and more about doubts over how fast AI data centers can keep being built. The Nasdaq Composite lost 1,421.52 points, or 5.52%, to close at 24,315, leaving it more than 10% below its October record (CBS News, Yahoo Finance). Just one day earlier, the Dow had posted its biggest gain of the year after Democrats won both chambers of Congress. Thursday erased all of it.
This guide uses US market reports checked on November 6, 2026. It covers what fell and by how much, why selling concentrated in AI names, and a practical checklist for reading the days after a sharp one-day drop. It does not forecast where stocks go next.
The Nasdaq selloff by the numbers
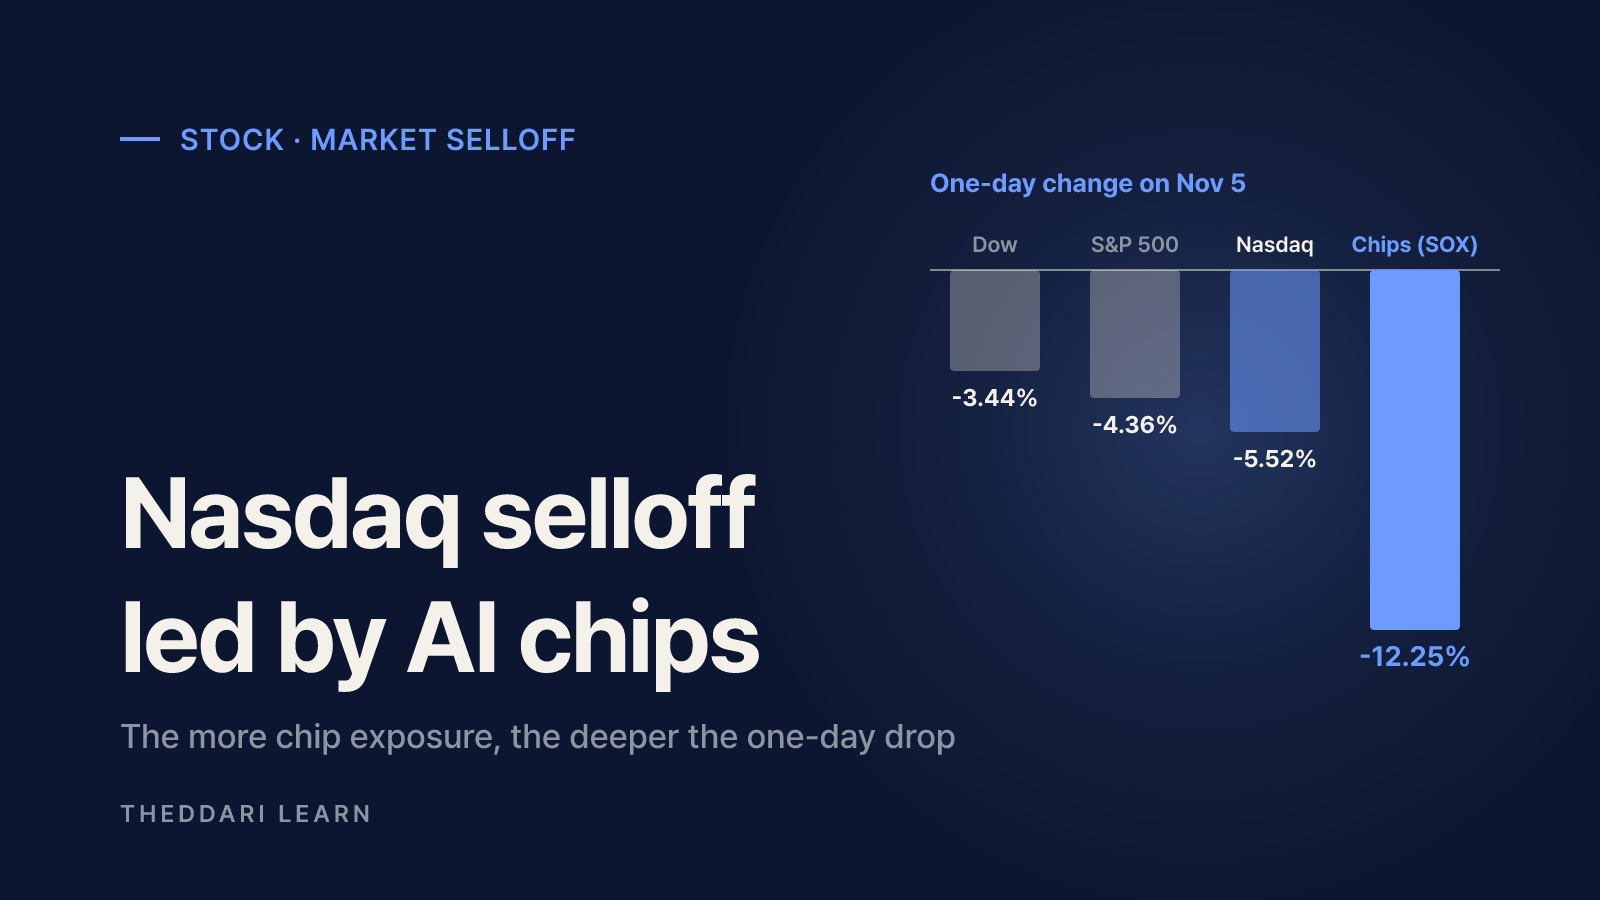
Losses scaled with exposure to AI hardware. The more an index leaned on semiconductors, the harder it fell, which is why analysts framed the day as a retreat from the AI trade rather than a generic panic.
Nasdaq Composite
- Change on Nov 5
- -5.52%
- Close and notes
- 24,315; closed in correction territory
Nasdaq-100
- Change on Nov 5
- -6.36%
- Close and notes
- About $2.3 trillion in market value erased
S&P 500
- Change on Nov 5
- -4.36%
- Close and notes
- 7,353.73; all 11 sectors lower
Dow Jones Industrial Average
- Change on Nov 5
- -3.44%
- Close and notes
- 51,523.06; down 1,833 points
Russell 2000
- Change on Nov 5
- -4.45%
- Close and notes
- Small caps fell too
PHLX Semiconductor (SOX)
- Change on Nov 5
- -12.25%
- Close and notes
- 9,011.14; second-biggest drop on record per Reuters
Nvidia
- Change on Nov 5
- -9.26%
- Close and notes
- $181.60, after a 3.2% loss the day before
AMD and Micron
- Change on Nov 5
- about -17%
- Close and notes
- SanDisk fell about 22%
Figures are closing values from Yahoo Finance's live coverage and Reuters' Trading Day column. You may see the S&P 500 drop reported as 4.3% or 4.4%; that is rounding and timing. The Guardian called it the Nasdaq's worst day in 18 months, the biggest since the April 2025 tariff shock.
What the AI trade retreat means
The AI trade is shorthand for the money that flowed into chipmakers, memory makers, networking suppliers, GPU cloud providers, and power names on the expectation that data center spending keeps compounding. Thursday's selling questioned that assumption from two directions.
Policy risk: a slower data center buildout
With Democrats controlling both chambers and winning key governor races, investors priced in more scrutiny of data center permitting and power demand. Capital Economics economist Joe Maher wrote that the immediate risk is that restrictions on data center construction slow the AI infrastructure buildout, a headwind for companies whose prospects depend on rapid capex growth (CBS News). The Guardian also noted that voters rejected data center projects in a series of local ballots.
No new federal rule has been passed. The new Congress is seated in January 2027, so concrete policy would show up later through hearings, bills, and state permitting decisions. Treat Thursday's move as pricing a possibility.
Positioning risk: year-end profit-taking
Nomura strategist Charlie McElligott argued the main driver was not a sudden deterioration in fundamentals but hedge funds rushing to lock in 2026 gains, part of a momentum unwind that had run for over a month. Retail investors joined in: Vanda Research estimated individuals sold a net $358 million of US stocks by mid-afternoon, on track for their biggest net selling day since March 2020 (Yahoo Finance).
Why concentration made it worse
Market-cap-weighted indexes move with their largest holdings. The same handful of AI winners that lifted the Nasdaq-100 on the way up dragged it down harder than the broader Composite on the way down, and SOX fell twice as much as either. Meanwhile, AppLovin rose about 31% on strong earnings that same day. A single index number hides that dispersion.
Indicators to check after a one-day plunge
Rather than reacting to one close, track these signals over several sessions. Together they help separate a positioning flush from a genuine change in trend.
- 1
Volatility: does the VIX stay elevated?
The VIX measures 30-day expected volatility implied by S&P 500 options. It jumped roughly 70% to about 28 on Nov 5. A quick fade points to a one-off shock; a VIX that stays high can mean forced deleveraging is still under way.
- 2
Leadership: is SOX still underperforming?
Chips were the epicenter. If the semiconductor index keeps lagging the Nasdaq, the AI trade unwind is likely continuing. If it stabilizes first, selling pressure may be easing.
- 3
Breadth: how many sectors are falling?
All 11 S&P 500 sectors fell on Nov 5. Watch whether declines narrow back to tech or spread further. Comparing the S&P 500 with its equal-weight version also shows whether the damage is concentrated in mega caps.
- 4
Trend: the 200-day moving average
Yahoo Finance reported that both the Nasdaq Composite and Nvidia broke below their 200-day moving averages. Whether they reclaim that line, and on what volume, is a widely watched technical test.
- 5
Rates and macro data
Reuters reported that after the rout, rate traders pushed expectations for the Fed's next hike back to March. Big releases like the October jobs report on Nov 6 can swing markets, so check the economic calendar before reacting.
- 6
Earnings guidance and capex plans
Qualcomm fell sharply after its results the same day. Whether policy fears turn into actual numbers will show up in hyperscaler capex plans and chipmakers' next-quarter guidance. The earnings calendar lists upcoming report dates.
How to read past selloffs without overfitting
Five-percent days are rare, and what followed them has varied. After the April 2025 tariff shock, the path depended on how tariff policy actually evolved. In March 2020, economic data and earnings mattered more. Because this drop mixed policy expectations with positioning, it helps to track each driver separately.
Positioning and deleveraging
- Evidence to watch
- Speed of VIX decline, retail and institutional flows
- What it would suggest
- Easing pressure can allow partial recovery, with no guarantee
Policy on data centers
- Evidence to watch
- Hearings, bills, state permits, local votes
- What it would suggest
- Real restrictions would change buildout forecasts
Fundamentals
- Evidence to watch
- Hyperscaler capex, chip guidance
- What it would suggest
- Only falling numbers would support a long-term trend change
Views were split on the day. AMD CEO Lisa Su told Yahoo Finance the market can be short-sighted and that she sees AI demand continuing, while other strategists noted many AI stocks were already deep below their highs. When opinions diverge this sharply, watching whether the evidence in the table actually changes is more reliable than picking a side. To follow what traders are discussing in real time, see the stock Telegram trends and AI Telegram trends pages.
Practical checks for your own portfolio
- Look at your fund's top holdings. A Nasdaq-100 or semiconductor ETF carries far more exposure to this kind of theme selloff than a total-market fund.
- Leveraged products such as 3x Nasdaq or chip ETFs amplify daily moves and can lose ground in choppy markets even if the index later recovers. Vanda noted some retail buyers added these funds on Nov 5.
- If you hold US assets from abroad, currency moves add to or offset price moves. The Korean won, for example, fell about 1% against the dollar that day.
- Separate the headline cause from confirmed facts. Policy worries are forecasts until bills or permits change.
In short, the November 5, 2026 Nasdaq selloff concentrated election-driven worries about data center regulation and year-end profit-taking into AI chip stocks. Checking volatility, chip leadership, breadth, the 200-day line, rates, and guidance over the coming sessions gives you a grounded way to judge whether this was a positioning shock or the start of a slower AI investment cycle.