Contents8 sections
- What happened in the November 2026 KOSPI plunge
- Foreign selling Korea: reading investor flows
- Did the won move with the selloff?
- KOSPI 200 futures, program trading and Korea's sidecar and circuit breaker
- Why KOSPI fell: reading sector declines
- A same-day checklist for a KOSPI selloff
- Frequently asked questions
- Sources and references
After a KOSPI plunge, the headline percentage tells you how much the index fell but not why or how widely. To understand a Korean selloff, read five indicators side by side: net buying by foreign, institutional and individual investors; the won-dollar exchange rate; KOSPI 200 futures and program trading; whether a sidecar or circuit breaker was triggered; and how far each sector and large stock dropped. This guide uses Korea Exchange (KRX) rules and Korean press coverage of the November 5-6, 2026 selloff, checked as of November 11, 2026. It applies to Korea's main board (the KOSPI market) and does not suggest when to buy or sell any security.
What happened in the November 2026 KOSPI plunge
According to Edaily, the KOSPI closed down 300.00 points, or 5.28%, at 5,383.80 on November 5, 2026. Korean media linked the drop to the US midterm election results and fears that new restrictions on AI data centers could slow demand for memory chips, so the heaviest selling hit semiconductor and AI-infrastructure stocks. The next morning the index fell more than 8% within minutes of the open, triggering a Stage 1 circuit breaker, and it closed 6.02% lower at 5,059.69. Measured from the November 3 close of 5,648.79, that was a 10.4% fall in three sessions.
Two 5%-plus days in a row look alike on a price chart, yet the data underneath them was different. The table below maps each indicator to where Korean investors usually find it and the question it answers.
Net buying by investor type
- Where to find it
- KRX data, Korean brokerage apps
- Question it answers
- Who sold and who absorbed it?
- Nov 5-6, 2026 example
- Foreigners sold a net 3.42tn won on Nov 5
USD/KRW
- Where to find it
- Seoul FX market 3:30 p.m. KST rate
- Question it answers
- Did selling turn into dollar demand?
- Nov 5-6, 2026 example
- 1,342.1 on Nov 5, 1,356.6 on Nov 6
Futures and program trading
- Where to find it
- KOSPI 200 futures, program trading data
- Question it answers
- Did basket selling push the cash market?
- Nov 5-6, 2026 example
- Non-arbitrage selling of 2.25tn won on Nov 5
Market safeguards
- Where to find it
- KRX notices
- Question it answers
- Did the speed of the fall cross a threshold?
- Nov 5-6, 2026 example
- Sell sidecar Nov 5, Stage 1 circuit breaker Nov 6
Sectors and large caps
- Where to find it
- Sector indexes, top market-cap stocks
- Question it answers
- Was the damage narrow or broad?
- Nov 5-6, 2026 example
- Medical and precision equipment down 11.48% on Nov 5
Foreign selling Korea: reading investor flows
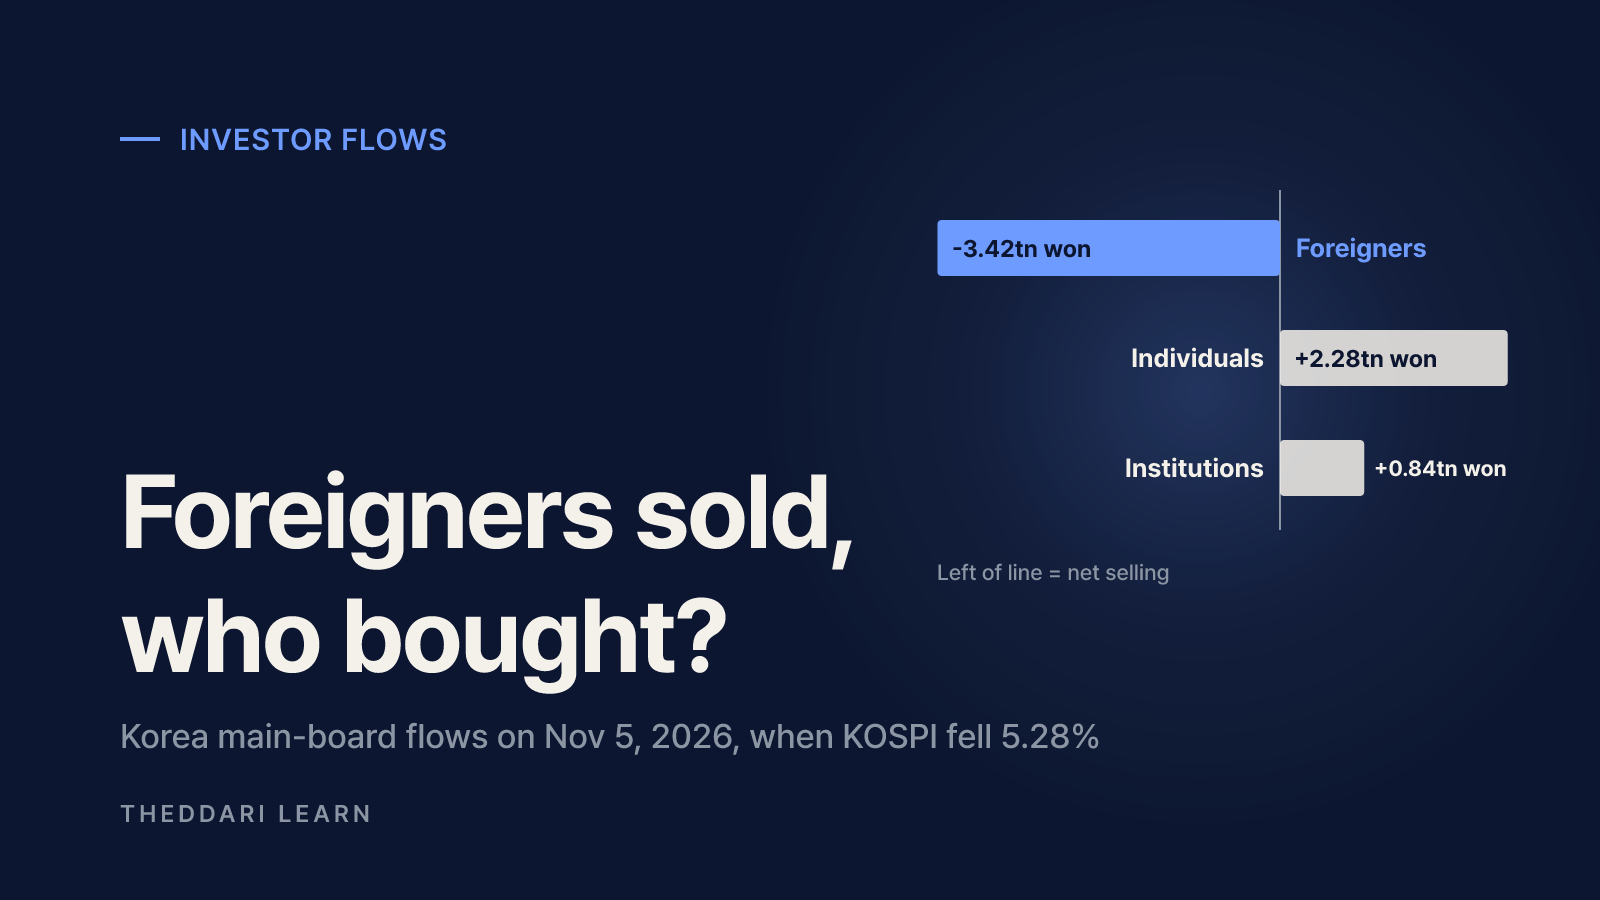
Korean exchanges publish daily net buying and selling by investor type, and foreign flows get the most attention because overseas investors own a large share of the biggest companies. On November 5, foreign investors sold a net 3.42 trillion won (₩3.4248tn) on the main board, while individuals bought a net 2.28 trillion won (₩2.2769tn) and institutions 0.84 trillion won (₩0.8417tn). Every share sold has a buyer, so the fact that local investors absorbed the selling does not mean they stopped the decline. What matters is urgency: an index down more than 5% tells you sellers were willing to accept much lower prices to exit.
Persistence adds information. Businesskorea reported that foreigners sold about 2.77 trillion won on November 6, extending a streak that began on October 30 to six sessions and roughly 12 trillion won (₩11.9949tn) in total. Institutions bought about 1.7 trillion won and individuals about 0.6 trillion won that day. A single heavy day can be a one-off index rebalance; a multi-day streak suggests investors are actively cutting their Korea weighting.
Check which stocks foreigners sold
Next, check concentration. On November 6 foreigners reportedly sold a net 1.924 trillion won of SK hynix but only about 128.6 billion won of Samsung Electronics. Selling focused on one or two mega-caps points to a sector view rather than a verdict on Korea as a whole. Broad selling across unrelated industries looks more like country-level risk reduction. Either way, the net figure alone cannot tell you the motive: profit-taking, benchmark changes and hedge adjustments all show up the same way.
Did the won move with the selloff?
Korea quotes the exchange rate as won per US dollar, so a higher USD/KRW number means a weaker won. Foreign investors who sell Korean shares and repatriate the money must buy dollars, which usually pushes the rate up. Yet on November 5 the 3:30 p.m. rate rose only 0.6 won to 1,342.1, even though the dollar index fell that day. Korean analysts read that as foreign equity selling offsetting what would otherwise have been a stronger won.
Edaily's November 9 analysis put numbers on the gap: from November 3 to 6 the KOSPI fell 10.4%, but USD/KRW rose only from 1,341.0 to 1,356.6, a 1.2% drop in the won's value. It cited three cushions: exporters converting dollars earned from strong chip sales, a weaker global dollar, and foreign holders reducing currency hedges as their stock positions shrank, which meant selling back dollar futures.
A practical reading: if stocks and the won fall hard together, money may be leaving Korean assets broadly or a strong dollar may be adding pressure. If the won stays relatively steady, a sector-specific story may be doing more of the damage. Treat this as a clue, not a rule, because the currency also reacts to trade flows, interest rates and US data. The same article flagged a stronger dollar after the US October jobs report and an expected $11.4 billion Samsung Electronics dividend payment to foreign shareholders on November 27 as possible sources of dollar demand. An economic calendar helps you line up such events with currency moves.

KOSPI 200 futures, program trading and Korea's sidecar and circuit breaker
KRX defines program trading as all index arbitrage plus non-arbitrage trades in which one party trades 15 or more KOSPI stocks at once. On November 5, arbitrage trades were net buyers of 341 billion won, but non-arbitrage trades were net sellers of 2.25 trillion won (₩2.2494tn), leaving total program trading 1.91 trillion won (₩1.9085tn) to the sell side. In plain terms, large basket sales of many stocks at once amplified the decline.
Futures often move before the cash market, so they show the speed of a selloff. On the morning of November 6, a broker analyst noted that KOSPI 200 night futures had been down around 7%, a warning of the gap the regular session faced at the open. That is useful context, but night-session moves do not always repeat in daytime trading. When futures or the index move past set limits, KRX safeguards switch on.
Reference
- Sidecar
- KOSPI 200 futures (benchmark contract)
- Circuit breaker
- KOSPI index
Trigger
- Sidecar
- 5% move from base price, held 1 minute
- Circuit breaker
- 8%, 15% or 20% fall from prior close, held 1 minute
What stops
- Sidecar
- Program orders in one direction
- Circuit breaker
- All trading, plus linked futures and options
Duration
- Sidecar
- 5 minutes, then queued orders execute
- Circuit breaker
- 20 minutes for Stages 1-2; Stage 3 ends the day
Limits
- Sidecar
- Lifted 40 minutes before the close
- Circuit breaker
- Once per stage per day; Stages 1-2 not in last 40 minutes
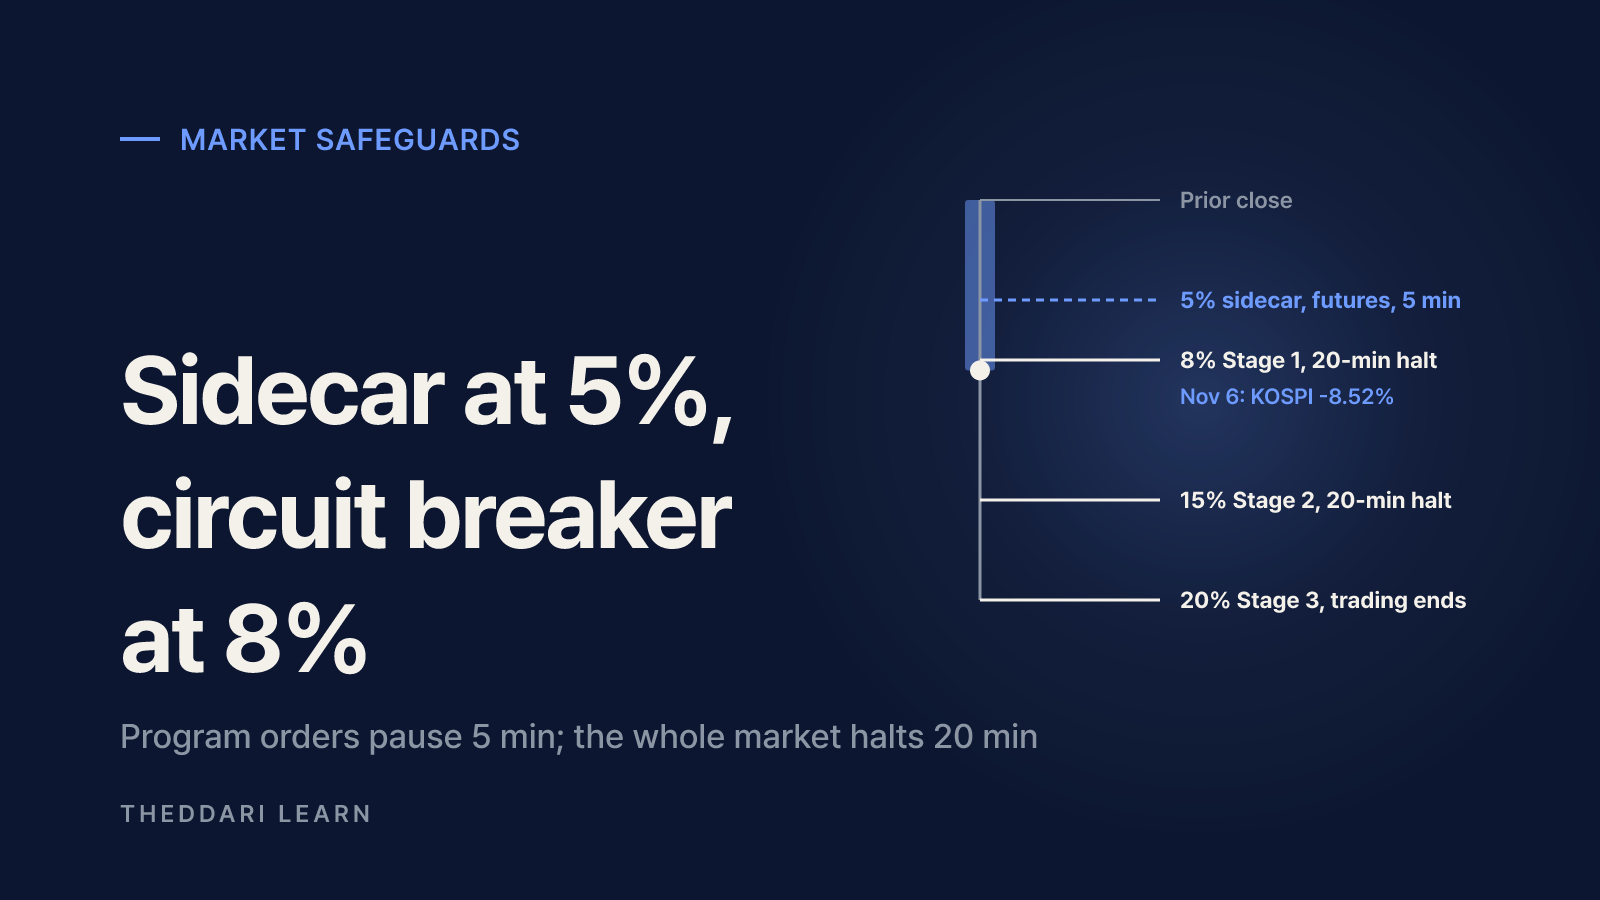
The November record shows the difference. At 10:16 a.m. on November 5, the mini KOSPI 200 futures contract fell 5.21%, from a base price of 890.44 to 843.96, and stayed there for a minute, so KRX suspended program sell orders for five minutes; program trading was 660.8 billion won net short at that moment. According to Herald Business, at 9:03:33 a.m. on November 6 the KOSPI was down 8.52% at 4,924.61, triggering a Stage 1 circuit breaker and a 20-minute halt. A sell sidecar followed at 9:34 a.m., right after trading resumed. It was the 17th KOSPI circuit breaker since the system began and the 11th of 2026.
A halt is not a bottom signal
The circuit breaker exists to give investors time to think, and the sidecar slows futures-driven selling from spilling into stocks. Neither changes the direction of the market. Herald Business noted that no Stage 2 or Stage 3 halt has occurred since the three-stage system was introduced in June 2015, but past absence does not rule out a future one. When a halt hits, the practical step is to check your open orders: new orders are blocked during a Stage 1 or 2 halt, while cancellations are allowed.
Why KOSPI fell: reading sector declines
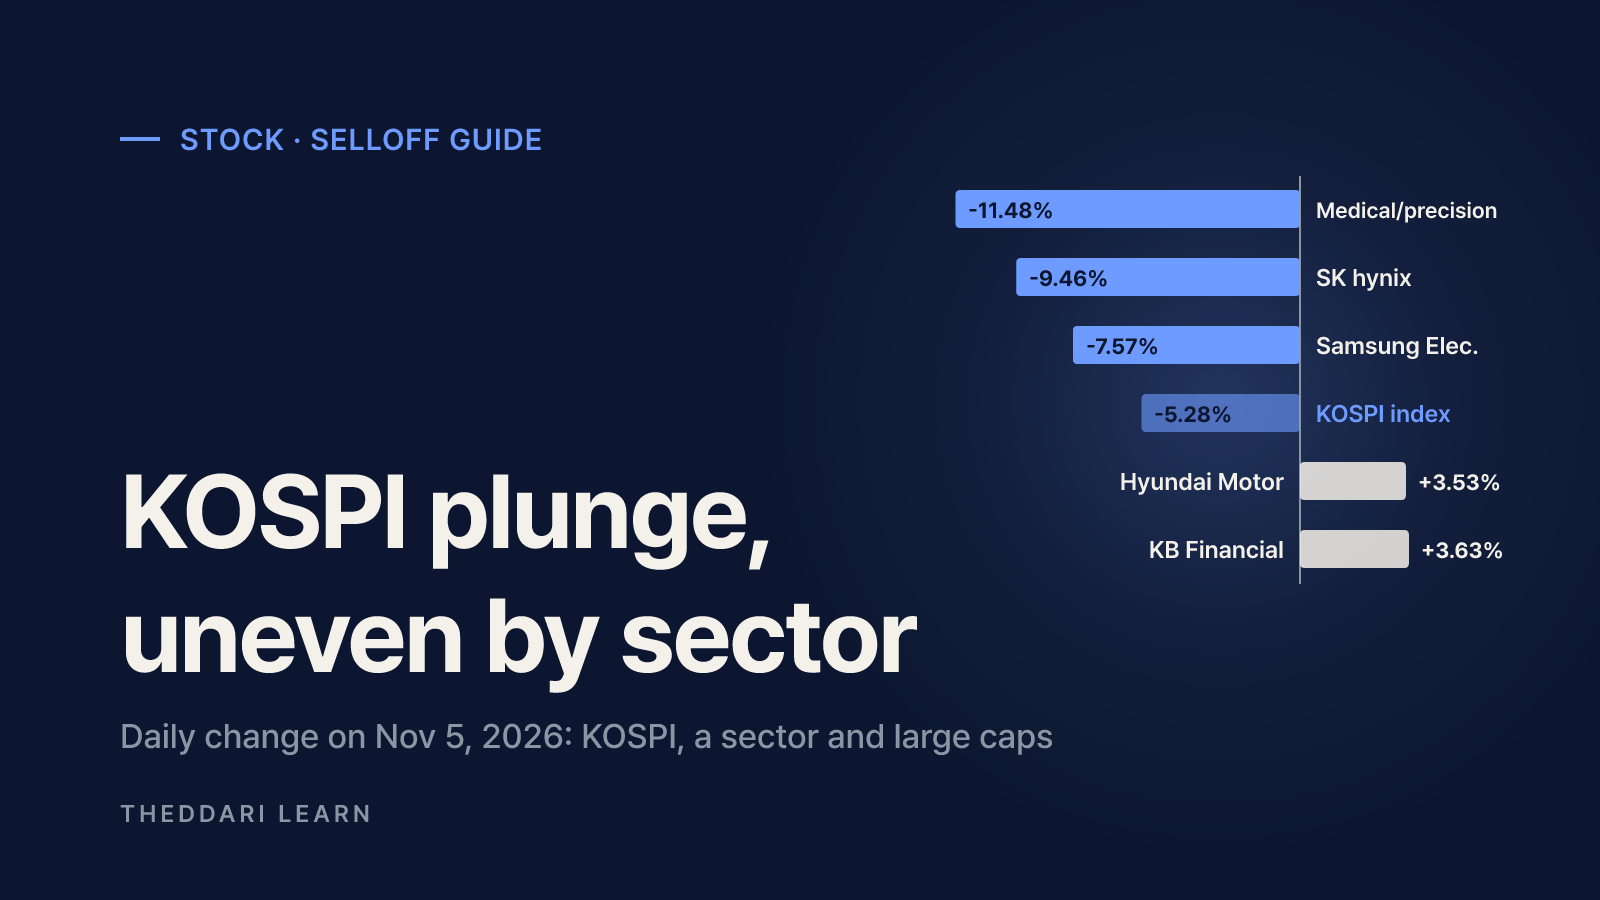
Because the KOSPI is weighted by market value, a few giant stocks can drive the index. Splitting the move by sector and large cap shows where the damage came from. On November 5, Samsung Electronics fell 7.57%, SK hynix 9.46% and Samsung Electro-Mechanics 15.34%, while the medical and precision equipment sector dropped 11.48%. At the same time, KB Financial rose 3.63%, Hyundai Motor 3.53% and Samsung Biologics 1.67%, and entertainment, IT services and pharmaceuticals each gained around 4%. Overnight in New York the S&P 500 had risen 1.58% while the Philadelphia Semiconductor Index fell 3.13%. The shock was aimed at the AI-infrastructure theme, not at Korean equities in general.
November 6 looked different. On the main board 760 stocks fell and 131 rose, and Naver was the only gainer among the 20 largest companies. Hyundai Motor (-4.77%) and KB Financial (-3.82%), which had risen the day before, also dropped. In one session, theme selling had turned into market-wide selling.
KOSPI
- Nov 5, 2026
- Down 5.28%
- Nov 6, 2026
- Down 6.02%
Where losses clustered
- Nov 5, 2026
- Chips, AI infrastructure, medical/precision equipment
- Nov 6, 2026
- Most of the top 20 stocks
What held up
- Nov 5, 2026
- Banks, autos, pharma, entertainment
- Nov 6, 2026
- Only Naver among the top 20
Safeguards
- Nov 5, 2026
- Sell sidecar
- Nov 6, 2026
- Stage 1 circuit breaker and sell sidecar
The comparison sharpens your next questions. If losses cluster in one theme, look at that theme's news flow and earnings dates. If they spread across the market, focus on currency, rates and overseas markets. Counting advancing and declining stocks alone tells you a lot about market breadth behind the index number. Stock-focused Telegram trend data can show which sectors investors are discussing, though heavy chatter does not indicate price direction.
A same-day checklist for a KOSPI selloff
- 1
Index and breadth
Note the KOSPI and KOSDAQ declines and the number of advancing and declining stocks. Decide whether a few mega-caps or most stocks drove the fall.
- 2
Investor flows and streaks
Record net buying by foreigners, institutions and individuals, and how many sessions each has moved in the same direction. List the stocks foreigners sold most.
- 3
Currency and overseas cues
Compare the change in the 3:30 p.m. USD/KRW rate with the index decline. Check the previous US session, US sector indexes and upcoming economic releases.
- 4
Futures, program trading and halts
Separate arbitrage from non-arbitrage program trading, check KOSPI 200 futures, and note the time of any sidecar or circuit breaker notice. Review your unfilled orders.
- 5
Narrow the cause by sector
Compare sector indexes and large-cap declines, then look up earnings dates and policy events tied to the hardest-hit theme.
Avoid a few common shortcuts. Do not read a foreign net-sell figure as a full exit from Korea, or retail net buying as a successful dip purchase. Do not treat a halt as a rebound signal, or one day of foreign buying as a new trend. If you hold leveraged products or use margin, losses can grow quickly on days like these, so check collateral ratios and product terms first. For companies at the center of the selloff, confirm reporting dates in an earnings calendar and cross-check them with company filings.
Each number on a KOSPI plunge day answers a different question. Flows show who sold; the won shows whether money left Korea; futures and program trading show the speed and mechanics; sidecars and circuit breakers show whether that speed crossed regulatory thresholds; and sector moves show how far the damage spread. Logging all five lets you compare the next selloff with this one on the same terms.