Contents8 sections
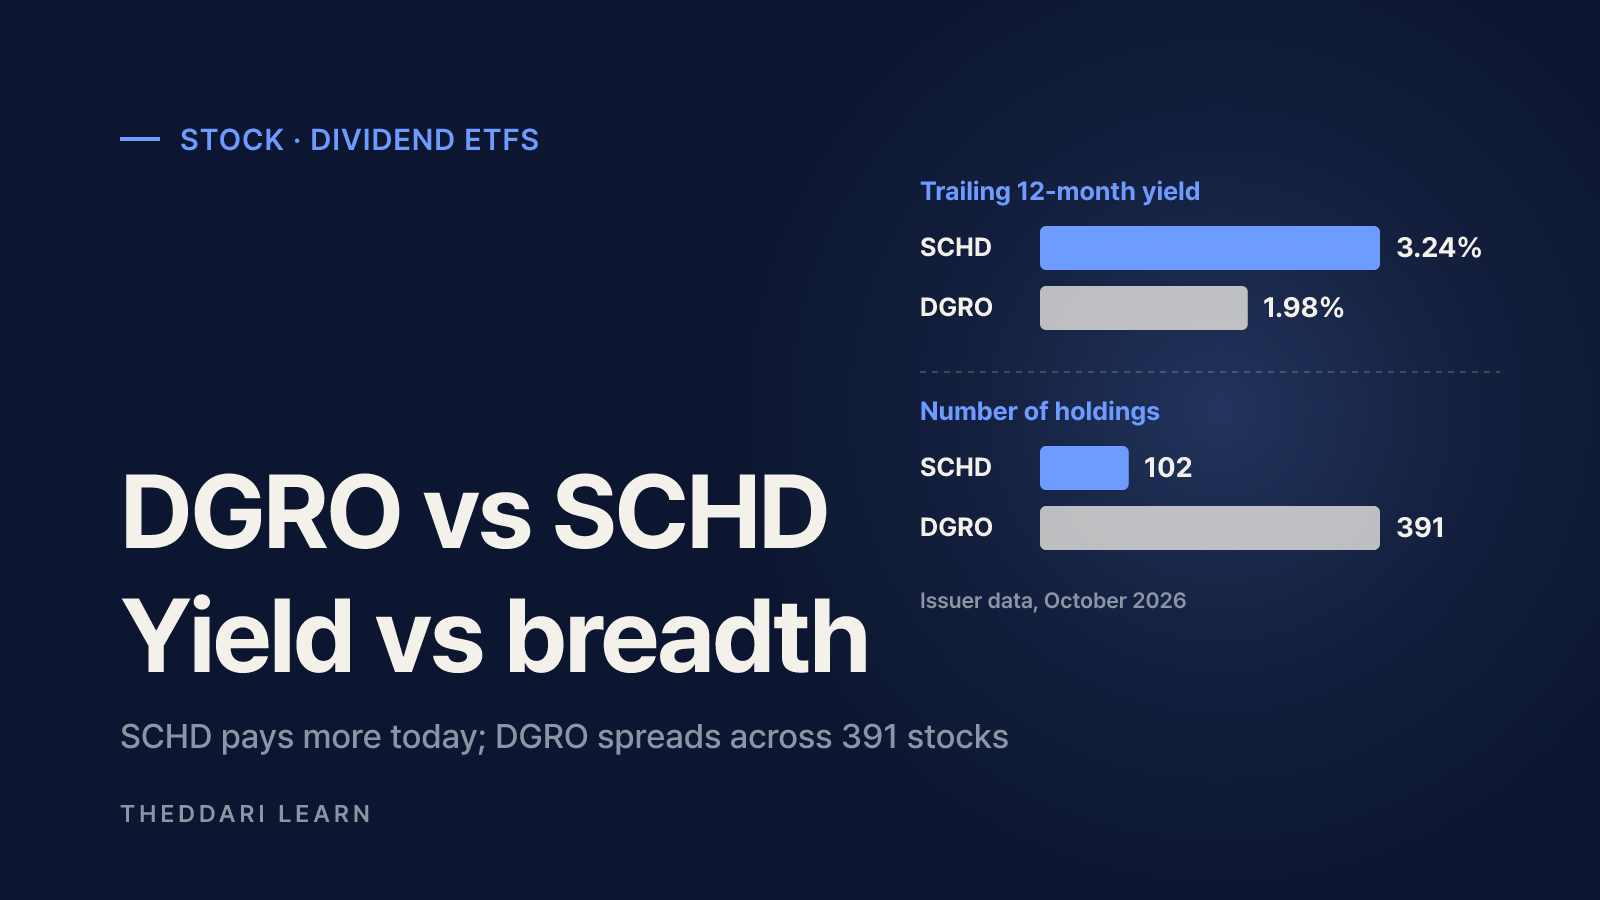
The short answer to DGRO vs SCHD: SCHD pays more income today from a concentrated basket of about 100 financially strong dividend stocks, while DGRO spreads across nearly 400 companies that have raised dividends for at least five years. As of October 2026, SCHD's trailing 12-month distribution yield was 3.24% versus 1.98% for DGRO, their dividend growth rates were close, and which fund returned more depended on the time period you pick.
Interest in this matchup has picked up with claims that DGRO will overtake SCHD as the leading dividend growth ETF. Rather than argue, this guide lines up the published numbers from the iShares DGRO fund page and the Schwab SCHD fund page, using September and October 2026 data. Yields and returns change daily, so recheck them before you trade.
How each fund picks stocks
Both are passive index ETFs that pay distributions quarterly. Almost every difference you will see in yield, sectors and returns traces back to the index rules.
SCHD and the Dow Jones U.S. Dividend 100 Index
The Schwab U.S. Dividend Equity ETF launched on October 20, 2011 and tracks the Dow Jones U.S. Dividend 100 Index. Schwab describes the index as focused on the quality and sustainability of dividends, holding stocks that are fundamentally strong relative to peers based on financial ratios. As summarized by Dividend Wealth:
- A stock needs at least 10 consecutive years of dividend payments to qualify.
- Survivors are ranked on a composite of cash flow to total debt, return on equity, dividend yield and five-year dividend growth; the top 100 make the cut.
- Weights follow market cap with a 4% cap per stock and 25% per sector, with annual reconstitution and quarterly rebalancing.
DGRO and the Morningstar US Dividend Growth Index
The iShares Core Dividend Growth ETF launched on June 10, 2014 and tracks an index of U.S. stocks with a history of growing their dividends. The Morningstar index page lists a dividend-weighted scheme with annual reconstitution and quarterly rebalancing. The eligibility rules are:
- At least five consecutive years of dividend increases.
- A payout ratio below 75% and a positive consensus earnings forecast, so companies have room to keep raising payouts.
- No REITs, and no stocks whose yield sits in the top 10% of the eligible universe, a guard against likely dividend cuts.
- Weights are based on the dollar value of dividends paid, not market cap.
In plain terms, SCHD screens for high yield plus balance-sheet quality and keeps only about 100 names. DGRO screens for a record of raising dividends plus room to keep doing it, which lets in lower-yielding banks and tech companies and produces a much broader fund.
DGRO vs SCHD side by side
The table below uses figures from each provider's fund page. Dates differ slightly by metric, so check the date in parentheses. Returns are annualized NAV total returns as of September 30, 2026.
Index
- SCHD
- Dow Jones U.S. Dividend 100
- DGRO
- Morningstar US Dividend Growth
Expense ratio
- SCHD
- 0.060%
- DGRO
- 0.08%
Net assets
- SCHD
- $118.7B (Oct 23)
- DGRO
- $44.5B (Oct 23)
Holdings
- SCHD
- 102 (Oct 22)
- DGRO
- 391 (Oct 23)
Trailing 12-month yield
- SCHD
- 3.24% (Sep 30)
- DGRO
- 1.98% (Sep 30)
30-day SEC yield
- SCHD
- 3.12% (Oct 22)
- DGRO
- 2.07% (Sep 30)
1-year return
- SCHD
- 23.36%
- DGRO
- 12.95%
3-year return
- SCHD
- 15.44%
- DGRO
- 17.57%
5-year return
- SCHD
- 9.48%
- DGRO
- 10.96%
10-year return
- SCHD
- 12.44%
- DGRO
- 13.16%
3-year standard deviation
- SCHD
- 13.75%
- DGRO
- 10.45%
P/E ratio
- SCHD
- 18.24 (Sep 30)
- DGRO
- 24.60 (Oct 22)
SCHD led by a wide margin over the last 12 months, but DGRO was ahead by roughly one to two percentage points a year over three, five and ten years, and with lower measured volatility over the past three years. The fee gap is 0.02 percentage points, or about $2 a year on $10,000. On income, if trailing yields held steady, $10,000 would generate roughly $324 a year in SCHD versus $198 in DGRO before taxes. Those payouts are not fixed; they move with prices and distributions.
Holdings and sector weights
Schwab's top 10 SCHD holdings on October 22, 2026 were Procter & Gamble (4.41%), Texas Instruments (4.31%), Coca-Cola (4.25%), Chevron (4.21%), UnitedHealth (4.18%), ConocoPhillips (4.17%), Home Depot (4.04%), Qualcomm (4.00%), Amgen (3.97%) and PepsiCo (3.88%). Together they make up about 41.4% of the fund, with most positions pressing against the 4% cap.
Consumer staples
- SCHD (Sep 30)
- 19.97%
- DGRO (Oct 22)
- 12.92%
Health care
- SCHD (Sep 30)
- 19.20%
- DGRO (Oct 22)
- 17.56%
Energy
- SCHD (Sep 30)
- 15.38%
- DGRO (Oct 22)
- 5.70%
Information technology
- SCHD (Sep 30)
- 12.22%
- DGRO (Oct 22)
- 17.32%
Industrials
- SCHD (Sep 30)
- 11.28%
- DGRO (Oct 22)
- 11.14%
Financials
- SCHD (Sep 30)
- 9.14%
- DGRO (Oct 22)
- 19.31%
Consumer discretionary
- SCHD (Sep 30)
- 6.70%
- DGRO (Oct 22)
- 6.11%
Communication services
- SCHD (Sep 30)
- 6.01%
- DGRO (Oct 22)
- 0.14%
Utilities
- SCHD (Sep 30)
- 0.09%
- DGRO (Oct 22)
- 7.10%
SCHD is a defensive, value-leaning mix: staples, health care and energy are more than half the fund. DGRO puts about 37% in financials and tech, where large companies pay modest but rising dividends, and it owns utilities that SCHD largely skips. That sector split explains most of the recent performance gap. SCHD led in 2026 as staples and energy rallied, while DGRO did better in stretches when tech and financials led. If you want to see when the biggest holdings report results, the theddari earnings calendar lists upcoming report dates.
Dividend growth: how fast payouts rose
The table sums each fund's distributions per share by calendar year. SCHD's pre-split payouts are divided by three to reflect the October 2024 split. DGRO's 2021-2024 totals come from Dividend Wealth's tally; the 2025 total of $1.4506 matches the sum of iShares' published distributions.
2021
- SCHD
- $0.7499
- Change
- -
- DGRO
- $1.0718
- Change
- -
2022
- SCHD
- $0.8540
- Change
- +13.9%
- DGRO
- $1.1679
- Change
- +9.0%
2023
- SCHD
- $0.8862
- Change
- +3.8%
- DGRO
- $1.3159
- Change
- +12.7%
2024
- SCHD
- $0.9944
- Change
- +12.2%
- DGRO
- $1.3851
- Change
- +5.3%
2025
- SCHD
- $1.0476
- Change
- +5.3%
- DGRO
- $1.4506
- Change
- +4.7%
From 2021 to 2025, SCHD's payout compounded at about 8.7% a year and DGRO's at about 7.9%. The idea that a fund labeled 'dividend growth' must grow its payout faster does not hold in this window, partly because SCHD's own scoring includes five-year dividend growth.
Quarterly ETF distributions are lumpy. They shift with holdings' payment calendars, the annual reconstitution and fund inflows. Compare full-year totals instead of reacting to a single quarter.
Which one fits your portfolio
You value current income, prefer a defensive sector mix with less tech, and are comfortable with a concentrated portfolio where the top 10 names are about 41% of assets.
You can accept a lower starting yield in exchange for broad diversification across hundreds of companies, including banks and tech, and you value payout headroom.
- 1
Define the goal
Decide how much annual income you need and whether growth of principal or cash flow comes first.
- 2
Check overlap
If you already own an S&P 500 or Nasdaq fund, DGRO's tech and bank weights will overlap more. Download both providers' full holdings files to compare.
- 3
Use current data
Yields, holdings and sector weights change. Confirm the latest figures on the fund pages at the time you buy.
- 4
Watch rate-sensitive dates
Dividend stocks react to interest-rate expectations. The theddari economic calendar shows upcoming inflation, jobs and Fed releases.
- 5
Account for taxes
For U.S. investors, holding either fund in an IRA or 401(k) defers tax on distributions; in a taxable account, check how much of each payout is qualified. Non-U.S. investors face U.S. withholding plus home-country rules.
Risks to weigh
- Payouts can shrink. Schwab notes that holdings may cut or stop dividends, which affects the fund's ability to generate income.
- Dividend-focused funds underweight low-yield growth stocks and can lag the broad market when those stocks lead.
- SCHD's concentration and 25% sector cap mean a slump in staples, health care or energy hits harder. Its portfolio turnover was 40.61% as of September 30, 2026, so the annual reconstitution can reshape the fund noticeably.
- DGRO's P/E of 24.60 versus 18.24 for SCHD means more exposure to richly valued companies that can fall further in a growth sell-off.
- Past returns and past dividend growth do not predict future results.
For a sense of which stock topics traders are discussing, theddari stock Telegram trends tracks frequently mentioned themes, but buzz is not performance. The bottom line: choose SCHD if income today matters most, DGRO if breadth and dividend headroom matter more. Their payout growth has been similar, and leadership has rotated with sector trends, so think of them as two designs that win in different markets rather than one fund overtaking the other.