Contents8 sections
- Why an AI bubble ETF worry starts with cap weighting
- S&P 500 concentration: the top 10 holdings weight in numbers
- How the Nasdaq-100 differs from the S&P 500
- A five-step check for your own portfolio
- Equal weight ETF and other alternatives: trade-offs
- Pitfalls when reading concentration data
- Frequently asked questions
- Sources and references
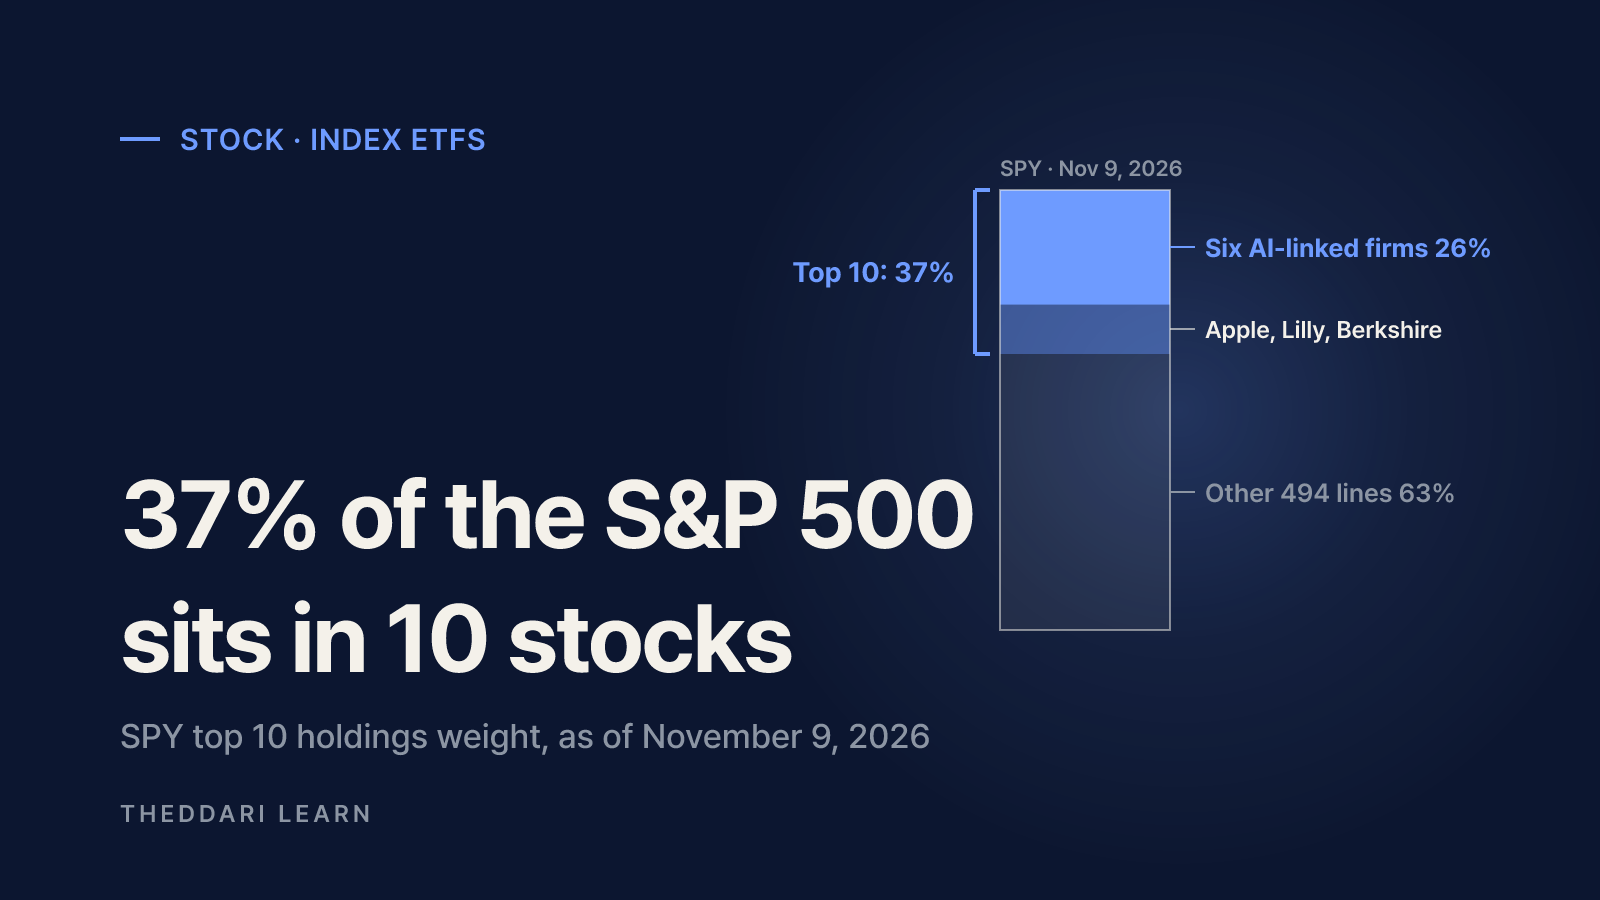
If an AI bubble ETF scenario worries you, the first useful step is not predicting the market but measuring how much of your index fund already rides on a handful of AI-linked companies. The short answer: more than most people assume. According to the SPY holdings page published by State Street, the fund's 10 largest holdings were 37.29% of assets as of November 9, 2026. This guide is written for investors who hold S&P 500 or Nasdaq-100 index funds such as SPY, VOO, IVV or QQQ. It shows how to calculate concentration yourself, how to estimate AI stocks exposure and what alternatives actually change.
Whether today's market is a bubble is a live debate, with some commentators arguing that AI enthusiasm is deflating and others arguing that earnings justify the valuations. This article does not settle that argument. It helps you translate the debate into a number that applies to your own portfolio.
Why an AI bubble ETF worry starts with cap weighting
The S&P 500 and the Nasdaq-100 are both market-cap weighted. State Street describes the S&P 500 as float-adjusted market capitalization weighted, which means a company's weight rises automatically as its share price rises. Every new dollar that flows into an index fund is split according to those weights, so the biggest companies receive the biggest share. Holding more than 500 stocks does not mean your money is spread evenly across 500 businesses.
Several asset managers have quantified how unusual the current level is. In a May 20, 2026 note, J.P. Morgan Asset Management put the top ten stocks at 40.8% of the S&P 500, well above the 26.6% peak of the tech bubble. The same note pointed out that those companies generate just over one-third of the index's earnings. That matters: the concentration is partly backed by profits, but it also means the index depends heavily on expectations for a few firms holding up.
HSBC Asset Management, using data as at July 2026, reported that ten companies accounted for 37.6% of the index. Measured by the Herfindahl-Hirschman Index, which sums the squared weight of every constituent, HSBC said the S&P 500 was more concentrated than at any point since at least 1994, including the dot-com peak. Its specialists distinguish theoretical diversification from meaningful diversification.
Why do sources disagree (37.29%, 37.6%, 40.8%)? They use different dates, index weights versus actual fund weights, and different treatment of Alphabet's two share classes. Compare like with like before drawing conclusions.
S&P 500 concentration: the top 10 holdings weight in numbers
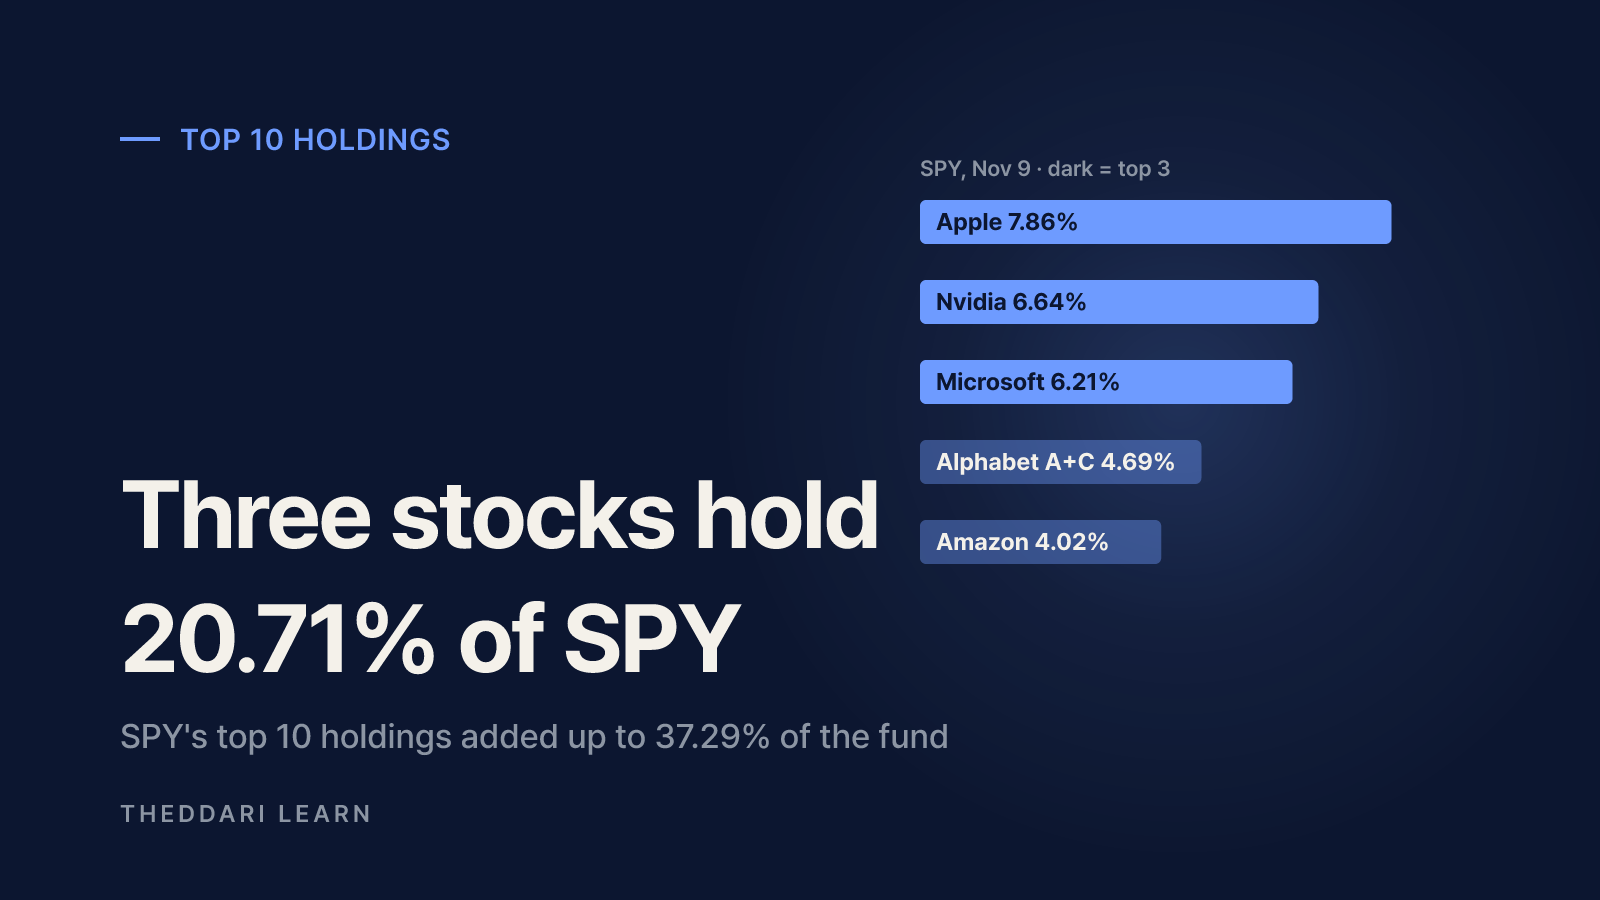
The table below lists SPY's top 10 fund holdings as of November 9, 2026, with a running total. Alphabet appears twice because Class A and Class C shares are separate lines, so these 10 lines represent nine companies.
1
- Holding
- Apple
- Fund weight
- 7.86%
- Cumulative
- 7.86%
2
- Holding
- Nvidia
- Fund weight
- 6.64%
- Cumulative
- 14.50%
3
- Holding
- Microsoft
- Fund weight
- 6.21%
- Cumulative
- 20.71%
4
- Holding
- Amazon
- Fund weight
- 4.02%
- Cumulative
- 24.73%
5
- Holding
- Alphabet Class A
- Fund weight
- 2.60%
- Cumulative
- 27.33%
6
- Holding
- Broadcom
- Fund weight
- 2.33%
- Cumulative
- 29.66%
7
- Holding
- Meta Platforms
- Fund weight
- 2.17%
- Cumulative
- 31.83%
8
- Holding
- Alphabet Class C
- Fund weight
- 2.09%
- Cumulative
- 33.92%
9
- Holding
- Eli Lilly
- Fund weight
- 1.73%
- Cumulative
- 35.65%
10
- Holding
- Berkshire Hathaway Class B
- Fund weight
- 1.64%
- Cumulative
- 37.29%
The top three alone made up 20.71%. SPY reported 504 holdings that day, which means the remaining 494 lines shared roughly 63% of the fund. Put differently, on a $10,000 position, about $3,729 sat in those 10 lines.
Estimating your AI stocks exposure
There is no official definition of an AI stock, so set your own rule and write it down. One reasonable basket is chip designers, cloud providers and platforms spending heavily on AI: Nvidia, Microsoft, Alphabet (4.69% for both share classes), Amazon, Broadcom and Meta. Those six companies totaled 26.06% of SPY, or about 26%. Add Apple and the figure becomes 33.92%. The exact number depends on your definition, so the method matters as much as the result.
Sector labels can understate the exposure. On the same date SPY reported Information Technology at 36.06%, Communication Services at 8.82% and Consumer Discretionary at 9.58%. Under the GICS system, Alphabet and Meta sit in Communication Services, while Amazon and Tesla sit in Consumer Discretionary. Technology plus Communication Services alone came to 44.88%.
A simple stress test helps make the exposure tangible. If those six companies fell 30% while everything else stayed flat, SPY would drop about 7.8% (26.06% × 30%). Real markets do not work that neatly, since other stocks usually move too, but the arithmetic shows how much of the fund's fate is tied to one theme.
How the Nasdaq-100 differs from the S&P 500
Invesco explains that QQQ tracks the Nasdaq-100, made up of the 100 largest non-financial companies listed on Nasdaq, and that the fund and index are rebalanced quarterly and reconstituted annually. Because banks and insurers are excluded, technology naturally takes up more of the index. Invesco labels QQQ a non-diversified fund and notes that investments focused in a particular sector, such as technology, are subject to greater risk and volatility.
The Nasdaq-100 uses the Industry Classification Benchmark (ICB) rather than GICS, so the same company may carry a different sector label in Nasdaq and S&P materials. When comparing the two indexes, compare company weights rather than sector names. Nasdaq's index methodology also includes rules for redistributing weight when the largest constituents become too dominant; check the official methodology document for the exact thresholds.
Many investors own both an S&P 500 fund and QQQ. Because the same megacaps lead both indexes, holding the two does not double your diversification. It can instead stack exposure to the same handful of AI-linked companies.
A five-step check for your own portfolio
- 1
List every index fund you hold
Record the ticker, the index it tracks and the dollar value in each account, including 401(k) and IRA funds. Target-date funds often hold an S&P 500 or total-market fund inside them, so look through to the underlying holdings.
- 2
Download the issuer's holdings
Use the Holdings tab or daily holdings file on the issuer's website, not a third-party summary, and note the as-of date.
- 3
Combine share classes
Merge Alphabet Class A and Class C, and any similar pairs, to get company-level weights. Keep both the top 10 lines total and the top 10 companies total so you can compare with published research.
- 4
Apply your AI definition
Decide which companies count as AI exposure and sum their weights. Using the same rule each quarter makes trends easy to spot.
- 5
Convert to dollars across accounts
Multiply each company's weight by your position in each fund, then add across funds. That gives your true dollar exposure to each megacap.
Because a few companies carry so much weight, their quarterly reports can move an entire index fund. Knowing when those reports land helps you anticipate when your portfolio faces company-specific news. An earnings calendar shows dates, not direction, and dates should be confirmed with each company's investor relations page.

The AI bubble debate also moves quickly through social channels. Tracking which AI topics are trending can show you what the market is talking about, but frequency of mention is not evidence. Read it alongside primary disclosures.
Equal weight ETF and other alternatives: trade-offs
If the concentration feels too high for your situation, several approaches are commonly discussed. None of them removes risk; each trades one kind of risk for another.
Equal-weight S&P 500 fund (e.g., RSP)
- What it reduces
- Influence of the largest companies
- What it adds
- More small and mid-size exposure, rebalancing turnover, risk of lagging megacap rallies
Combination of sector funds
- What it reduces
- Heavy technology weight
- What it adds
- You choose the sector mix, more products to monitor
Adding other regions or asset classes
- What it reduces
- Single exposure to US megacap tech
- What it adds
- Currency risk and risks specific to other markets
Keep cap weighting, cap your own exposure
- What it reduces
- Cost of switching funds
- What it adds
- Needs a written rule and regular rebalancing
An equal-weight index resets every constituent to roughly the same weight at each rebalance. With 503 constituents, that is about 0.2% each, so a company that holds more than 6% in the cap-weighted index is cut to the same size as the smallest member. The trade-off is turnover: the fund regularly sells recent winners and buys laggards, which can trail the cap-weighted index when megacaps keep leading. Fees are often higher too; SPY's gross expense ratio was 0.0945%, so compare any alternative's prospectus before switching. In taxable accounts, selling an existing fund to switch may also trigger capital gains.
Another option is to keep your low-cost cap-weighted fund and manage the total exposure at the portfolio level. For example, you can set a personal ceiling for AI-linked exposure and direct new contributions elsewhere when you exceed it. This avoids switching costs but depends on sticking to the rule.
Pitfalls when reading concentration data
- Match the dates. Weights change daily with prices, and rankings can shift within weeks.
- Separate index weights from fund weights. Funds hold small cash balances and can differ by fractions of a percent.
- Separate companies from share lines. Alphabet's two classes change the total.
- High concentration does not tell you when a decline will happen. Concentration has stayed elevated for long periods before.
- Look at earnings concentration as well. Large weights backed by large profits are different from weights driven by expectations alone, but both are exposed if expectations fall.
The practical takeaway: record your fund's top 10 holdings weight and your AI exposure, together with the date and the rule you used. As of November 9, 2026, SPY's top 10 lines were 37.29% and six AI-linked companies were about 26%. Whether that is too much depends on your time horizon and how large a loss you can tolerate. Repeat the same calculation every quarter, and you will see whether your exposure is drifting higher or lower.