Market Breadth vs the S&P 500: Is a Narrow Rally a Warning?
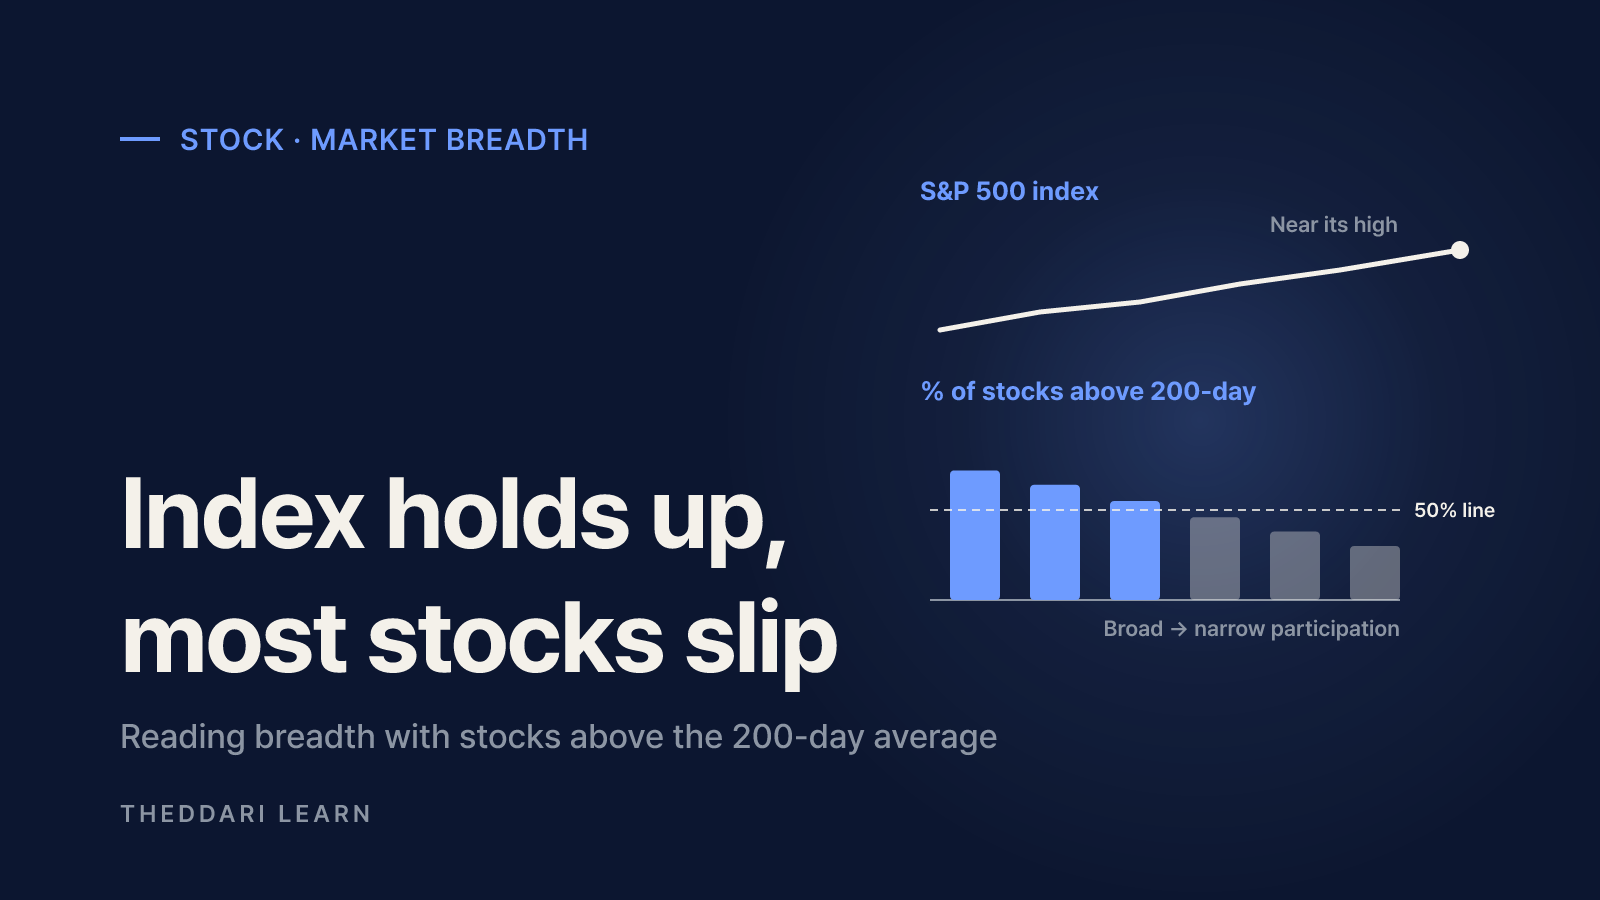
Most S&P 500 stocks in a correction while the index holds up? How to read market breadth: stocks above the 200-day, the A/D line and equal weight.
Contents8 sections
- What is market breadth, and why can the index and the average stock disagree?
- S&P 500 correction vs stock-level correction: what the numbers mean
- Four market breadth indicators compared
- How to check a claim like '80% of stocks are in a correction'
- Limits of market breadth: when the warning sign misleads
- Bottom line: a breadth checklist to use with the index
- Frequently asked questions
- Sources and references
Key takeaways
- Market breadth counts how many stocks take part in a move. It shows whether the S&P 500 is being carried by a few mega caps or by most of its members.
- A correction usually means a 10%+ drop from a recent high and a bear market a 20%+ drop. Index-level and stock-level corrections are different things.
- The share of S&P 500 stocks above their 200-day moving average is often read around a 50% line. A new index high that breadth fails to confirm is the classic warning sign.
- Weak breadth is not a crash timer. It can stay weak for months, and extremely weak readings have sometimes appeared near short-term lows.
- Before reacting to a headline like '80% of S&P 500 stocks are in correction territory', check the date, the definition of the high, and the data source.
If most S&P 500 stocks are in a correction while the index itself holds up, that is a sign of weak market breadth: the rally is being carried by fewer companies. It is a reason to pay attention to risk, not proof that a crash is coming. This guide, based on investor education material from FINRA, Charles Schwab and StockCharts checked as of October 2026, explains what a correction actually means, the four breadth indicators most people use, how to sanity-check a viral claim like '80% of S&P 500 stocks are in correction territory', and where breadth signals break down. It covers the U.S. stock market only.
What is market breadth, and why can the index and the average stock disagree?
The S&P 500 is a market-cap-weighted index. The bigger the company, the more it moves the index. When a handful of mega caps rally hard, the index can climb even while most of the other members slip. Looking at the index level alone, you cannot tell whether the whole market is healthy or a few giants are doing the heavy lifting.
Market breadth fills that gap by counting participation instead of price. Schwab compares it to the market's blood pressure and lists the common approaches: the share of stocks above a moving average, advancing versus declining stocks, and new highs versus new lows (Charles Schwab). What matters most is whether breadth moves in the same direction as the index.
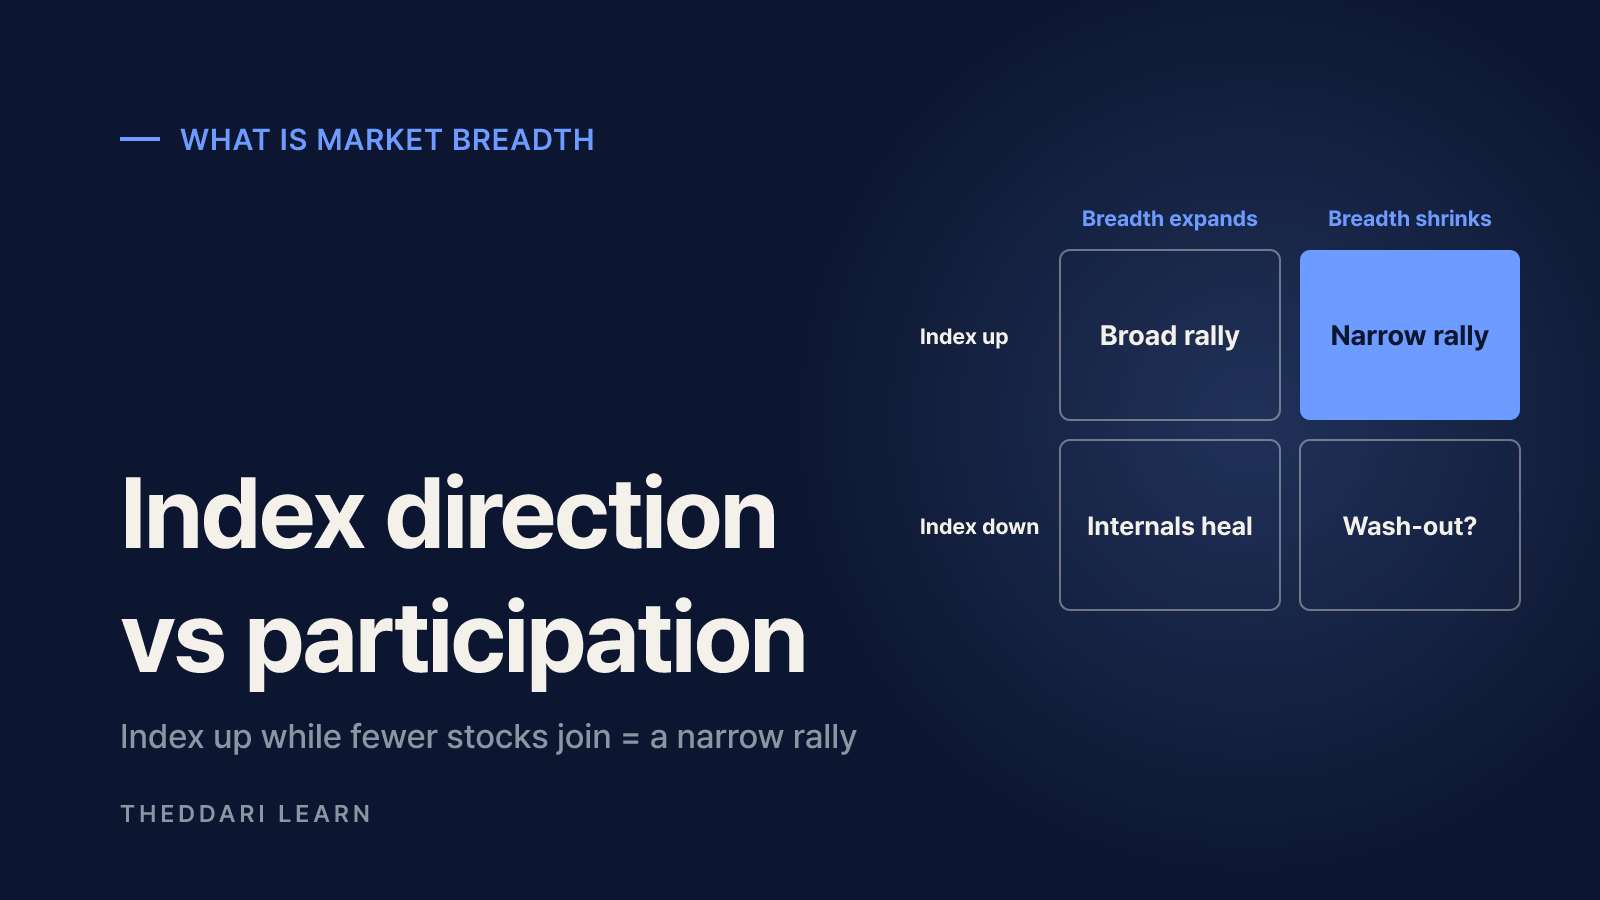
- Index up, breadth expanding: a broad rally with wide participation.
- Index up, breadth shrinking: a narrow rally. If the leaders stumble, the index has little support underneath.
- Index down, breadth improving: the surface looks weak, but the internals may be healing.
- Index down, breadth collapsing to extremes: nearly everything is falling, which can also mean selling is getting exhausted.
Schwab points to mid-2023 and mid-2024, when rallies led by the so-called Magnificent Seven faded and the rest of the market washed out with them. The same article stresses that narrow rallies can run for a long time before a catalyst hits, so narrowness alone does not set a timetable.
S&P 500 correction vs stock-level correction: what the numbers mean
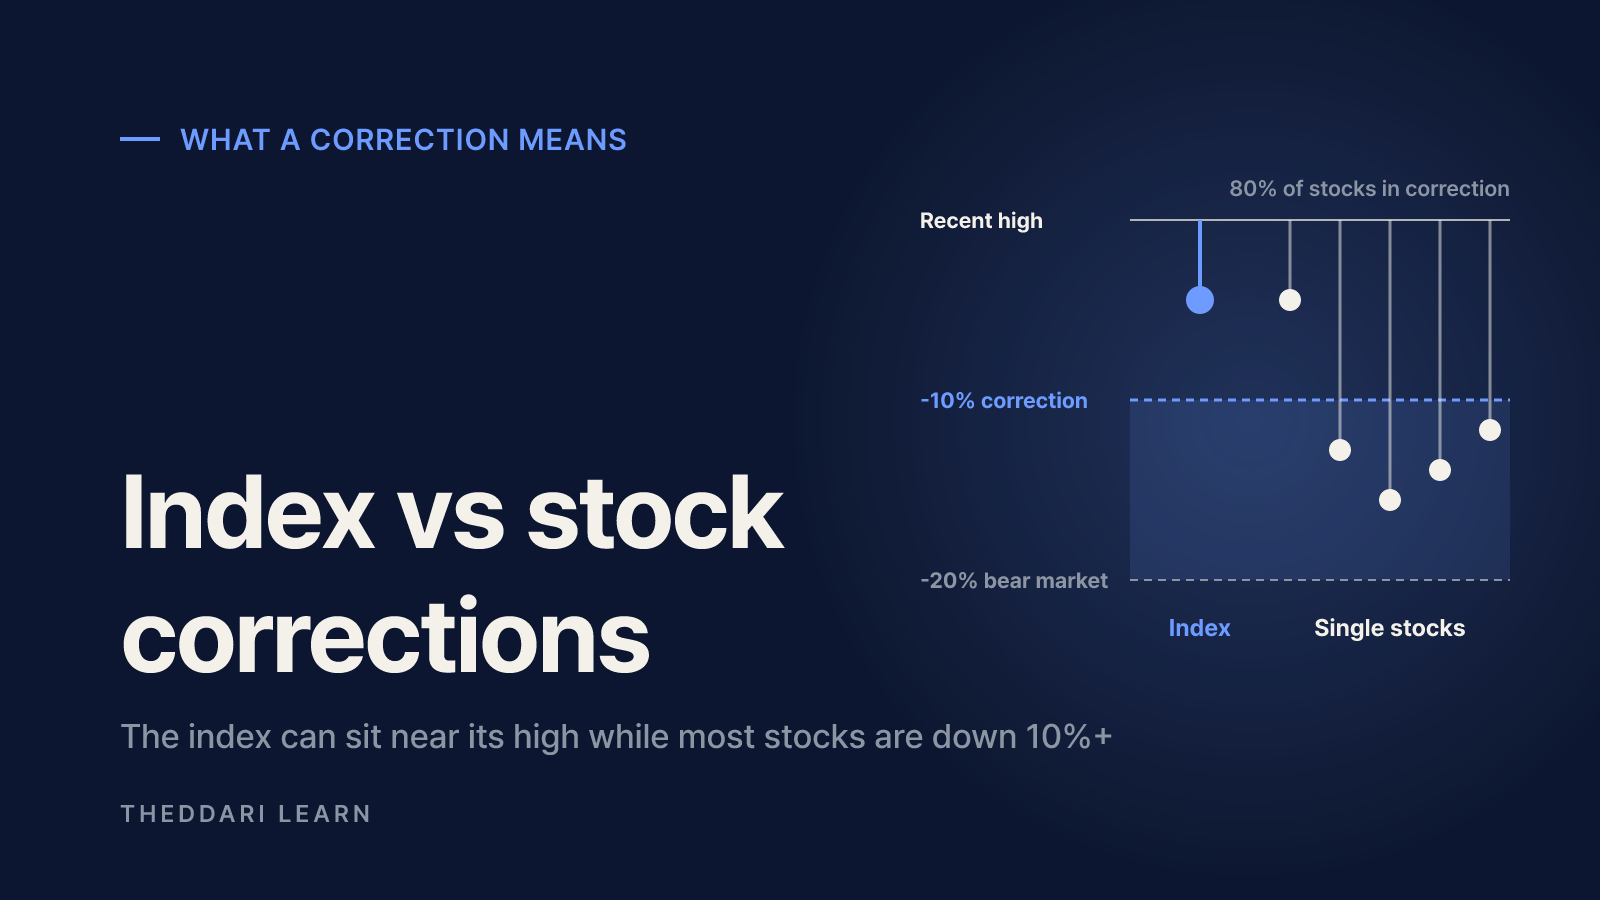
There is no official definition of a correction. FINRA describes it as a reversal of at least 10% before the prior trend resumes, and says a decline of 20% or more in a broad index generally meets the bear market threshold (FINRA). Schwab uses the same working range: down more than 10% but less than 20% from the most recent peak (Charles Schwab).
Index correction
- Typical threshold
- S&P 500 down 10% to under 20% from its recent high
- What it tells you
- The cap-weighted market as a whole has pulled back
Bear market
- Typical threshold
- Broad index down 20% or more
- What it tells you
- A deeper, usually longer decline
Stock-level correction
- Typical threshold
- An individual stock down 10% or more from its own high
- What it tells you
- That stock is falling; the index may not be
'X% of stocks in correction'
- Typical threshold
- Share of index members meeting the stock-level test
- What it tells you
- How widespread the damage is, i.e. breadth
So '80% of S&P 500 stocks are in correction territory' does not mean the index is down 10%. It means roughly 400 of about 500 members are each at least 10% below their own highs. Single stocks are far more volatile than the index, so this share can be high even when the S&P 500 is close to a record. The result also changes a lot depending on whether the high is a 52-week high or an all-time high.
History argues against panic, too. Schwab counted 27 S&P 500 corrections from November 1974 through its March 14, 2025 update, and only six became bear markets. That is a record of the past, not a forecast for the next one.
Four market breadth indicators compared
% of stocks above 200-day
- Calculation
- Stocks above their 200-day average ÷ all members
- Main signal
- Above or below 50%; divergence from the index
- Weak spot
- Frequent whipsaws around 50%
Advance-decline line
- Calculation
- Running total of advancers minus decliners
- Main signal
- Index makes a new high, A/D line does not
- Weak spot
- Counts a tiny stock the same as a giant
New highs vs new lows
- Calculation
- New highs minus new lows
- Main signal
- Are new lows expanding?
- Weak spot
- Noisy day to day
Equal weight vs cap weight
- Calculation
- Equal weight index ÷ cap-weighted index
- Main signal
- Falling ratio = concentration in mega caps
- Weak spot
- Sector mix also moves the ratio
Percentage of stocks above the 200-day moving average
StockCharts calculates it as the number of members above a given moving average divided by the total number of members; 80 S&P 500 stocks above their 50-day average works out to 16%. The 50-day version suits short-to-medium-term reads, while the 150-day and 200-day versions suit longer horizons. Above 50% suggests a bullish bias and below 50% a bearish one. Because the 50-day version swings widely, readings above 70% are often treated as overbought and below 30% as oversold (StockCharts). On many U.S. charting platforms the symbols are $SPXA200R and $SPXA50R.
A real-world example from Schwab: on April 9, 2025, as the S&P 500 hit a tariff-driven 15-month low, the share of members above their 50-day average fell to 4%. By late May it had climbed to around 80%. A 200-day average covers roughly ten months of trading, which makes it the better fit for long-term investors.
Advance-decline line
Add each day's advancing issues minus declining issues to a running total and you get the advance-decline line. When the index sets a new high but the A/D line stalls below its prior peak, that is a bearish divergence. Because every stock counts once, small caps get the same vote as mega caps, which is both the point and the limitation.
Equal weight vs cap-weighted S&P 500
The equal weight S&P 500 holds the same companies at the same weight and periodically rebalances them back to equal. When it lags the regular index, gains are concentrated in the largest names; when it leads, the average stock is keeping up. The two versions have different sector mixes, so tech weighting also moves the ratio.
How to check a claim like '80% of stocks are in a correction'
Before acting on a viral breadth statistic from a video title or social post, run through these checks.
- 1
Pin down the definition
Is a correction measured as 10% off the high? Is the high a 52-week high or an all-time high? Closing prices or intraday? Different choices produce very different numbers on the same day.
- 2
Find the date and the raw data
Note when the figure was measured and who calculated it. A number with no traceable source is a talking point, not evidence.
- 3
Compare it with the index
How far is the S&P 500 itself from its high? An index near its peak with most members in correction is a narrow market; an index that is also down sharply is a broad decline.
- 4
Cross-check other breadth gauges
See whether the 200-day percentage, the A/D line and equal weight relative performance all point the same way. Schwab explicitly recommends using more than one breadth reading.
- 5
Look at what is coming up
Rate decisions, jobs and inflation releases, and mega-cap earnings can swing breadth sharply in either direction.

In a top-heavy market, a few earnings reports from the largest companies can change the index's direction. Knowing when the leaders report makes breadth shifts easier to interpret.
You can also watch which tickers and themes are drawing attention on the stock Telegram trends page. Mention volume reflects interest, though, not breadth itself.
Limits of market breadth: when the warning sign misleads
- False signals are common. StockCharts notes that even the 200-day version whipsaws across 50%, and suggests smoothing it with a 20-day moving average.
- Weak breadth can persist. Schwab says breadth can stay low for months when the Federal Reserve is raising rates quickly or the economy is in recession. Weakness alone does not tell you when a turn will come.
- Small divergences are weak evidence. StockCharts finds sharp divergences lasting two months or more more reliable than shallow ones lasting one to two weeks.
- Index composition distorts readings. After the April 2025 low, the Nasdaq Composite rallied strongly while only 55% of its members were above their 50-day averages, partly because biotech, with many small listings, lagged.
- Extremes can mark lows. When nearly every stock sits below its moving average, selling may be exhausted, so 'bad breadth means lower prices' is too simple.
Breadth is a diagnostic of how widely the market is moving right now. It does not predict returns. Avoid making all-or-nothing portfolio moves on a single breadth reading; check your time horizon and how much loss you can tolerate first.
Bottom line: a breadth checklist to use with the index
- Note how far the S&P 500 is below its recent high (10% or more is usually called a correction, 20% or more a bear market).
- Check whether the share of stocks above the 200-day average is above or below 50%, and which way it has moved in recent weeks.
- Look for a new index high that breadth fails to confirm, and whether that divergence has lasted two months or more.
- Compare the equal weight S&P 500 with the cap-weighted index to gauge concentration.
- Verify the date, definition and source behind any 'X% of stocks' headline.
- Read breadth alongside the economic and earnings calendar, and do not time trades on one indicator.
An index that holds up while most of its stocks are in correction is usually a market leaning on a few giants. That makes it more fragile if the leaders crack, which is worth factoring into risk decisions, but it does not tell you when or whether a decline will come. Tracking the direction of breadth, its divergence from the index and the events ahead keeps one viral number from driving your decisions.
Frequently asked questions
Can the S&P 500 hit a record while most of its stocks are falling?
What percentage of stocks above the 200-day moving average is bearish?
Does a correction in most stocks mean a stock market crash is coming?
How do you compare the equal weight S&P 500 with the regular index?
Sources and references
- 1Percent Above Moving Average — StockCharts ChartSchool(opens in a new tab)chartschool.stockcharts.com
- 2Breadth Check: Strength and Weakness Trend Tracker — Charles Schwab (June 26, 2025)(opens in a new tab)www.schwab.com
- 3Market Correction: What Does It Mean? — Charles Schwab (March 14, 2025)(opens in a new tab)www.schwab.com
- 4Key Terms for Tough Times: The Vocabulary of Stressed Markets — FINRA (June 3, 2025)(opens in a new tab)www.finra.org
Related articles
 Stocks
How Much Does GTA 6 Drive Take-Two Stock? Guidance to Watch
As GTA 6 arrives on November 19, 2026, here is how much of Take-Two's outlook rests on Rockstar, how TTWO reacted to past delays, and the post-launch numbers that matter.
 Stocks
SELLAS Life Sciences (SLS): REGAL Data and Dilution Risk
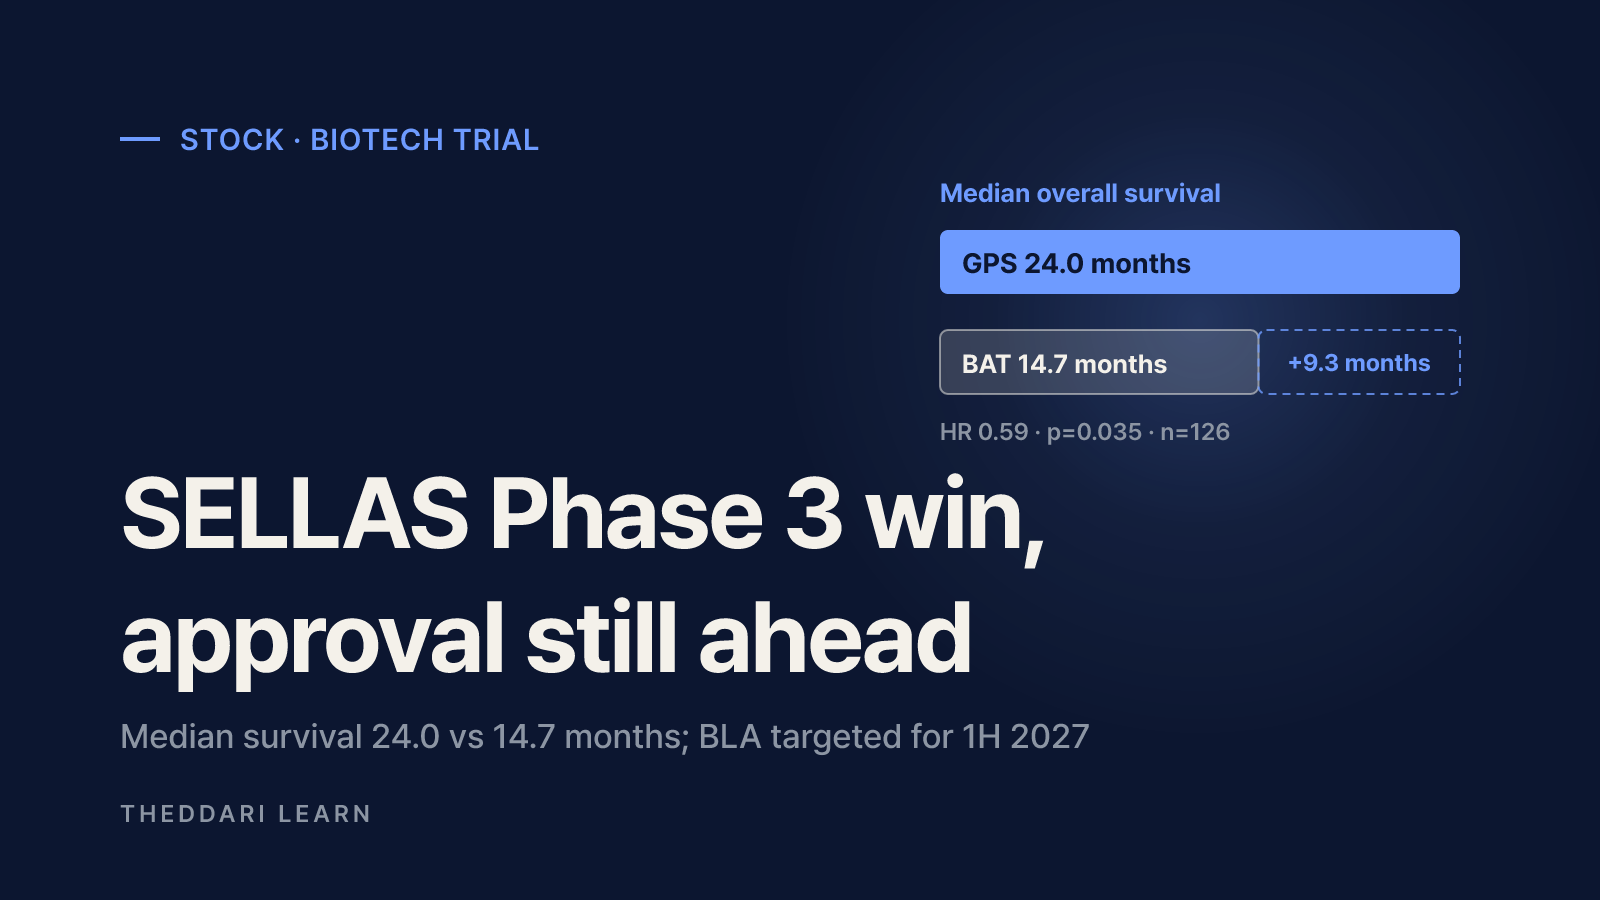
SELLAS (SLS) is a pre-revenue Nasdaq biotech developing GPS, a WT1 peptide vaccine for acute myeloid leukemia, and the CDK9 inhibitor SLS009. Here is how to read the November 17, 2026 Phase 3 topline, the upcoming catalysts, and the cash and dilution picture.
 Stocks
Samsung Special Dividend: Record Date, Ex-Date and Tax
Samsung confirmed a KRW 4,601 per-share Q3 2026 dividend, but the next payout will only be set by its board in late January 2027. Here is how record dates, ex-dates and Korean withholding tax work.