Contents7 sections
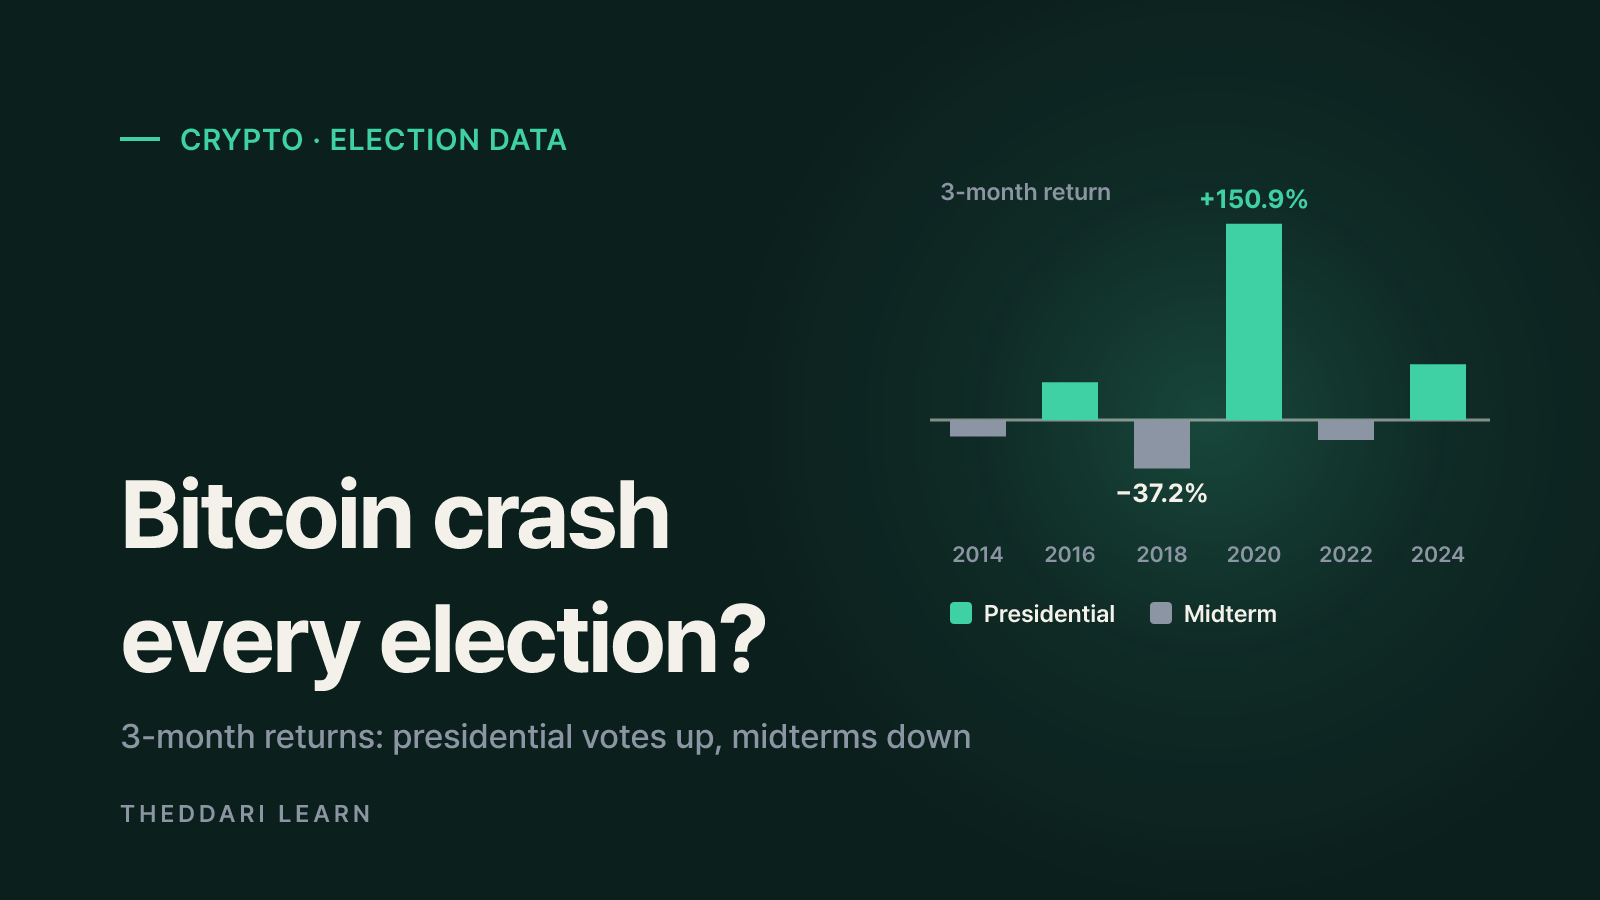
The bitcoin US election record does not show a crash every cycle. Across the six federal elections since 2014, bitcoin was higher the day after the vote five times, and it was higher three months after all three presidential elections. The weak spot is the midterms: three months after each of the 2014, 2018 and 2022 midterms, bitcoin traded lower. This guide is written on November 3, 2026, the day of the US midterm elections, and uses Corgano's election event study, which is based on daily closes through November 1, 2026.
The goal is not to predict what happens this week. It is to give you a way to check claims like 'bitcoin always dumps after elections' or 'elections are always bullish' against the actual numbers, and to understand why six data points cannot carry that much weight.
Bitcoin US election data: does BTC crash? The short answer
It depends on how you define a crash and which window you look at. Over the first trading day after the vote, only one of six elections produced a large drop: the 2022 midterm, at −22.9%. The other five moved between +1.7% and +11.5%. Switch to a three-month window and the picture changes: all three midterms were lower, with 2018 the worst at −37.2%.
Context matters too. According to Corgano, the median three-month return starting from any day since 2014 was +7.0%, and bitcoin was higher 58% of the time. The median three-month return after elections (+8.2%) and the share of positive outcomes (50%) are not meaningfully different from that baseline. In other words, the election periods do not stand out from ordinary bitcoin volatility as clearly as headlines suggest.
Returns here run from the last daily close before election day to the close 1, 21, 63 and 252 trading days later, following Corgano's method. Other studies use calendar days or the election-day close, so their numbers will differ.
Bitcoin price around six US elections since 2014
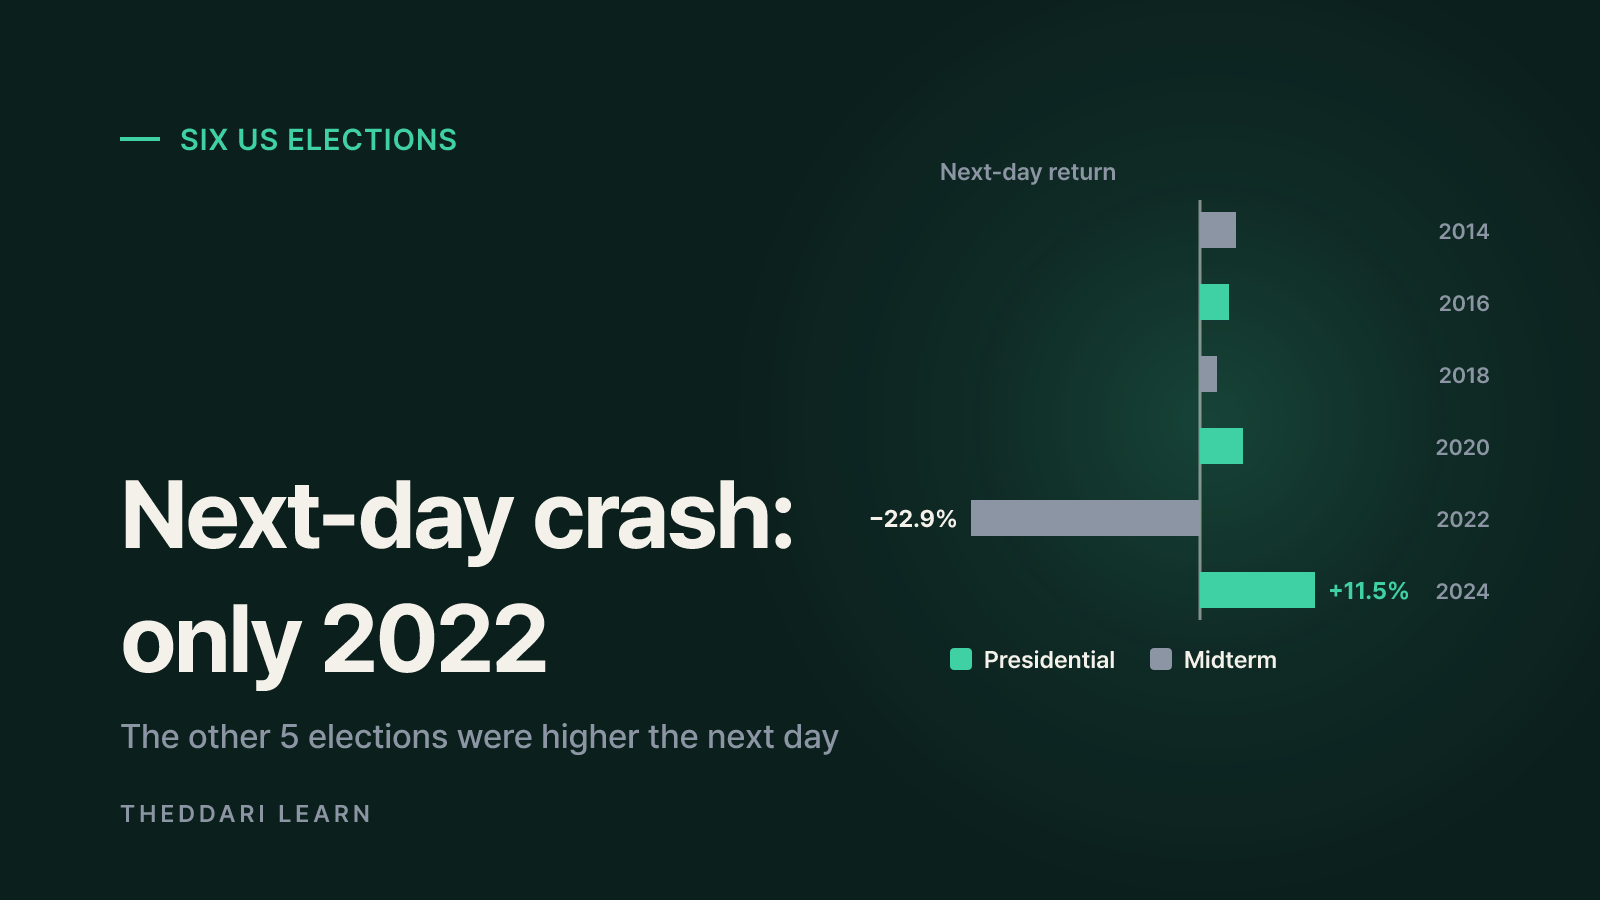
The table below reproduces Corgano's figures. The starting price is the US dollar close before the election.
Nov 5, 2024
- Type
- Presidential (Trump)
- Price before
- $67,812
- 1 day
- +11.5%
- 1 month
- +35.6%
- 3 months
- +42.9%
- 12 months
- +73.7%
Nov 8, 2022
- Type
- Midterm
- Price before
- $20,603
- 1 day
- −22.9%
- 1 month
- −20.2%
- 3 months
- −15.3%
- 12 months
- +44.9%
Nov 3, 2020
- Type
- Presidential (Biden)
- Price before
- $13,550
- 1 day
- +4.3%
- 1 month
- +41.0%
- 3 months
- +150.9%
- 12 months
- +141.3%
Nov 6, 2018
- Type
- Midterm
- Price before
- $6,420
- 1 day
- +1.7%
- 1 month
- −40.5%
- 3 months
- −37.2%
- 12 months
- +47.6%
Nov 8, 2016
- Type
- Presidential (Trump)
- Price before
- $703.13
- 1 day
- +2.9%
- 1 month
- +4.6%
- 3 months
- +29.1%
- 12 months
- +229.8%
Nov 4, 2014
- Type
- Midterm
- Price before
- $327.55
- 1 day
- +3.6%
- 1 month
- +14.6%
- 3 months
- −12.6%
- 12 months
- −12.2%
Three things stand out. Next-day moves were mostly small, with 2022 as the exception. After presidential elections, bitcoin was higher at one, three and twelve months in every case. After midterms, it was lower at three months every time, but higher at twelve months in two of three cases. A three-month view suggests post-midterm weakness; a one-year view largely reverses that conclusion.
The 2012 election and the pre-election dip
The 2012 vote predates the table but appears in many articles. CNBC reported 90-day post-election returns of roughly 87%, 44% and 145% for 2012, 2016 and 2020. Note that CNBC's 44% for 2016 differs from Corgano's +29.1% three-month figure, a reminder that start dates, window definitions and price sources change the answer. On the run-up, The Block quoted Bitfinex analysts describing a drop of about 16% roughly two months before the 2020 vote and more than 30% about three months before the 2016 vote.
Why presidential and midterm years look different
Before crediting the election, look at what else was happening. Bitcoin's supply issuance halves roughly every four years, and 2012, 2016, 2020 and 2024 were both presidential election years and halving years. CNBC noted this overlap as one reason post-election returns were strong. Bitwise Europe's research went further, arguing that past elections lined up with halvings and troughs in the US business cycle, and that those factors were likely the main drivers. The most recent halving took place on April 20, 2024.
Midterms fall about two years after a halving, a stage of the four-year pattern that has often coincided with post-peak corrections. The 2022 midterm window also overlapped with the collapse of the FTX exchange. In its December 13, 2022 charges against founder Samuel Bankman-Fried, the SEC said FTX's collapse highlighted the risks unregistered crypto platforms pose. Reading the 2022 drop of −22.9% as a midterm effect ignores that shock.
Halving cycle
- How it overlaps with elections
- Presidential years are halving years
- What to watch for
- Post-election gains mix with the halving cycle
Rates and liquidity
- How it overlaps with elections
- Fed policy shifts often near elections
- What to watch for
- Check the economic calendar for the same week
Industry shocks
- How it overlaps with elections
- FTX collapsed right after the 2022 midterm
- What to watch for
- One event can dominate a single case
Policy expectations
- How it overlaps with elections
- Crypto policy was a 2024 campaign issue
- What to watch for
- Polls and prediction markets price it early
Policy expectations were unusually visible in 2024. CNBC reported that bitcoin rose about 9% to a record above $76,000 as Donald Trump's win became clear, with traders pointing to promised deregulation and a change in SEC leadership. Yet Bitwise's same analysis found that sensitivities of major assets such as BTC and ETH to election betting odds were not statistically significant and had low R-squared, meaning factors outside the election, including the US dollar, monetary policy and the halving, explained more of bitcoin's moves.
That is why it helps to check scheduled macro releases alongside election dates. A Fed meeting, a CPI print or a jobs report in the same week can easily be mistaken for an election reaction. The theddari economic calendar lists those releases so you can see what else landed in the window you are studying.

How to read bitcoin election statistics
- 1
Pin down the window and starting price
Is the base the election-day close, the prior close or the open? Are periods measured in trading days or calendar days? The same 2016 election shows +29.1% or about 44% depending on the source.
- 2
Compare against a baseline
A post-election median of +8.2% over three months looks solid until you see that the median for any three-month window since 2014 is +7.0%. An election effect needs to differ from normal behavior.
- 3
Prefer medians and individual cases
The three-month average after elections is +26.3%, but 2020's +150.9% pulls it up sharply. In small samples one outlier can dominate the mean, so read every case.
- 4
List overlapping events
Write down halvings, Fed decisions, exchange failures, ETF approvals and other news in the same window. The longer that list, the weaker any claim about the election alone.
- 5
Check the source and data date
Note which exchange prices are used, the last data date and who calculated the figures. Marketing material can highlight only favorable windows.
If you trade derivatives, also watch funding rates. Election nights can bring sharp swings in both directions, and crowded leveraged positions raise liquidation risk. The theddari funding rate page shows how funding differs across exchanges, which gives a rough sense of how one-sided positioning has become.
Limits of a six-election sample and the 2026 midterms
The biggest limitation is sample size. Federal elections come every two years, so there are six cases since 2014 and only three midterms. Three outcomes in the same direction happen by chance one time in eight even with a coin flip. Corgano itself stresses that its figures describe what bitcoin did, not what the result caused.
The market has also changed. Bitcoin went into the 2014 midterm near $327 and into the 2024 presidential vote near $67,800. Spot ETFs, corporate treasuries and deep derivatives markets now shape who holds and trades it, so a reaction from a decade ago may not repeat. And because polls and prediction markets move ahead of the vote, election-night moves often reflect the gap between expectations and outcomes rather than the outcome itself.
According to USAGov, midterms are held halfway between presidential elections, with all 435 House seats and one-third of the Senate on the ballot. A change in congressional control could shift expectations around crypto market structure legislation, but three past midterms cannot tell you which direction or how much. With bitcoin trading around $76,000 in early November 2026, the market is far larger than it was before the 2022 midterm, when it sat near $20,600.
- When you see a post-election crash claim, check which election and which window it uses.
- Three down quarters after midterms may reflect a tiny sample rather than a rule.
- Log Fed dates, inflation data and industry events in the same week before blaming the vote.
- Leverage magnifies election-night volatility and raises liquidation risk.
Bottom line: bitcoin has not crashed at every US election. It rose after recent presidential elections and was weak for a few months after midterms, but both patterns overlap with halving cycles, monetary policy and industry events. Treat election statistics as a calendar reminder that volatility may rise, and as a prompt to review your position size and risk limits, not as evidence that history will repeat this time.