AI Model Comparison Website Guide: What Score Gaps Mean
How to read an AI model comparison website or leaderboard: intelligence, speed and price axes, error margins, rank spreads, and why small gaps often tie.
目录6 个章节
核心要点
- An overall intelligence score on an AI model comparison website is a weighted average of several benchmarks, so check the weights and components first.
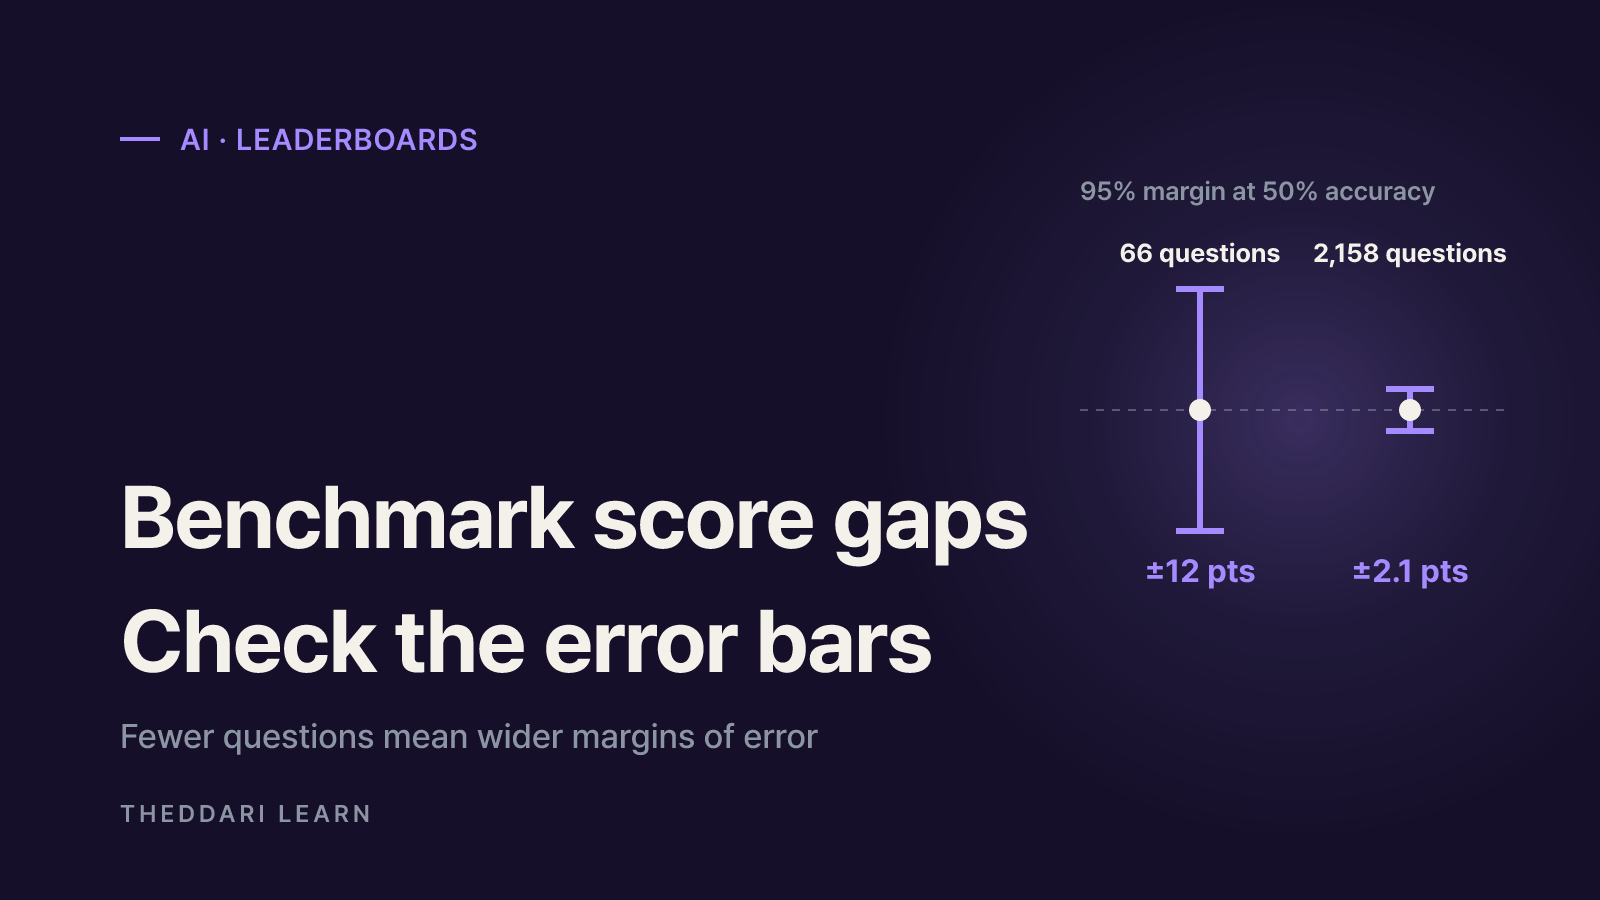
- Small benchmarks are noisy. On a 66-question test near 50% accuracy, a rough 95% margin of error is about plus or minus 12 percentage points.
- Vote-based leaderboards such as Arena publish confidence intervals and a rank spread; overlapping spreads mean a statistical tie.
- Settings like temperature, output token limits and agent harness, plus answer-length bias, contamination and selective disclosure, can all move rankings.
- Use leaderboards to build a shortlist, then decide with a small test set drawn from your own work.
When an AI model comparison website shows one model a point or two ahead of another, the first question is not who won but whether the gap is larger than the margin of error. Small benchmarks produce noisy scores, and test settings, answer style and disclosure practices can reshuffle a ranking. This guide uses the published methodology of Artificial Analysis and Arena (formerly LMArena), as checked in October 2026, to explain what each axis on a comparison chart measures and how much weight a score gap deserves. It does not recommend a model; it gives you a reading routine that works on any leaderboard.
What an AI model comparison website actually measures
Most comparison sites plot three things side by side: an intelligence or quality score, speed, and price. A model that leads on one axis can trail on another, so decide which axis matters for your job before reading the chart.
The headline index is a weighted blend
According to the Artificial Analysis methodology page, Intelligence Index v4.3.2 combines 10 evaluations weighted as Agents 30%, Coding 20%, Scientific Reasoning 20% and General 30%. Coding, for example, includes Terminal-Bench 4.0 (66 tasks, run 3 times) and SciCode at 10% each, while Scientific Reasoning includes Humanity's Last Exam (2,158 questions) and CritPt at 10% each. The same page notes the index is primarily an English, text-based suite, with image, speech and multilingual performance benchmarked separately.
A high index score therefore means a model did well on average under that particular weighting. If your workload is, say, non-English customer support or a niche programming language, a relevant sub-benchmark or a separate index will tell you more. Index versions also change their components and weights, so a screenshot from a few months ago is not directly comparable with today's chart.
Speed and price depend on the provider and your usage
The site's definitions separate output speed (tokens per second after the first token) from time to first token. For reasoning models, time to first answer token is closer to the wait you actually feel, because thinking tokens arrive first. The blended price assumes a 7:2:1 ratio of cache-hit, input and output tokens, so an output-heavy workload can cost very differently from the headline number. Cost per task rises for models that write long answers or reason at length, even when per-token prices are identical.
Intelligence index
- What it means
- Weighted average of benchmarks
- What to check
- Weights, version and test language
Single benchmark
- What it means
- Accuracy or Elo on one skill
- What to check
- Question count, repeats, grading method
Output speed / TTFT
- What it means
- Measured API responsiveness
- What to check
- First answer token time for reasoning models
Blended price
- What it means
- Price at a 7:2:1 token mix
- What to check
- Recalculate with your own token ratio
Cost per task
- What it means
- Average cost to finish one index task
- What to check
- Long reasoning inflates real cost
How much should you trust a score gap? Sample size and error bars
A benchmark is an experiment. Evan Miller's paper on adding error bars to evals treats evaluation questions as a sample from a larger population of possible questions and recommends reporting statistical uncertainty whenever two models are compared. The practical takeaway: the fewer the questions, the more a score can swing if you reran the test on a fresh draw.
Here is a back-of-the-envelope check using a simple binomial approximation at around 50% accuracy. For a 66-question test, the 95% margin is 1.96 × √(0.5 × 0.5 ÷ 66) ≈ 0.12, or roughly plus or minus 12 percentage points. For a 2,158-question test, the same formula gives about plus or minus 2.1 points. Repeated runs smooth out a model's response randomness on the same items, but they cannot add new questions. Treat these figures as intuition, not exact intervals; real confidence intervals depend on accuracy level, correlation between items and grading.
The effect shrinks at the index level. A benchmark weighted at 10% with a swing of about 12 points moves the index by roughly 1.2 points on a simple calculation. Errors across benchmarks partly cancel, but we could not find a published confidence interval for the overall index on the methodology page as of October 2026. A one- or two-point index gap is best read as a near tie.
On vote-based leaderboards, read the rank spread
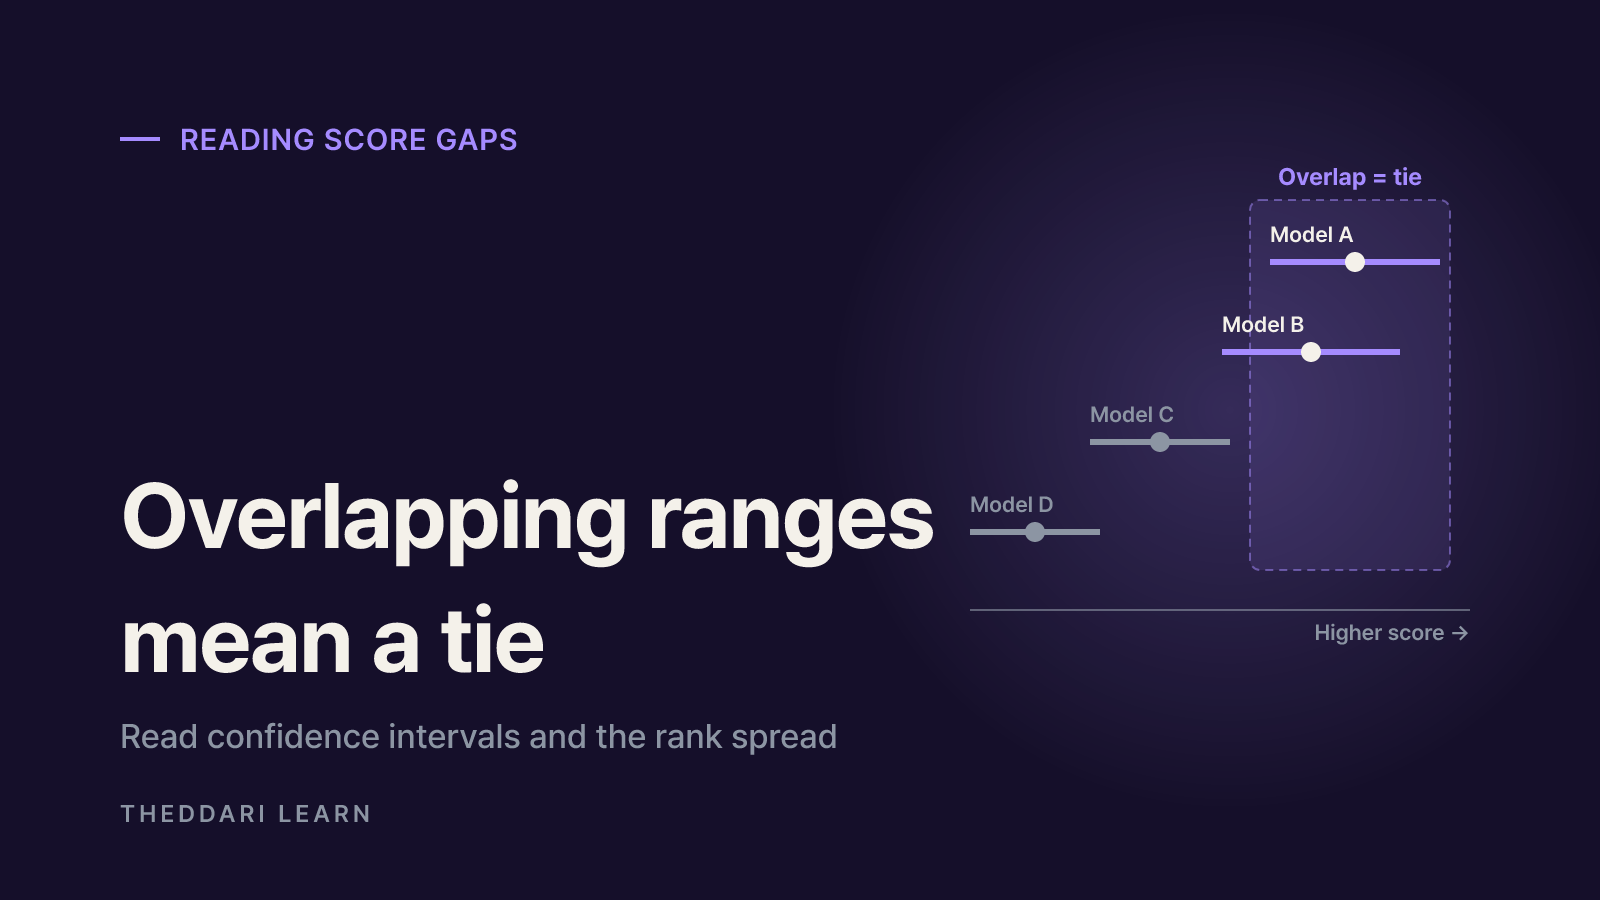
Arena ranks models from head-to-head user votes using a Bradley-Terry model and shows a confidence interval next to each score. Arena's ranking method post explains that every model now carries a raw rank and a rank spread. The best possible rank is one plus the number of models whose lower bound sits above this model's upper bound; the worst is one plus the number whose upper bound sits above this model's lower bound. Overlapping spreads mean a tie, and the raw rank is simply the current best estimate.
New models have fewer votes and wider intervals. Arena says its older display showed only the optimistic rank, which flattered uncertain newcomers, and that it now weighs optimistic and pessimistic ranks equally. When you see a launch-day headline about a new number one, check the vote count and rank spread first.
Four things that move an AI benchmark leaderboard
Even a gap outside the margin of error is not automatically a pure difference in model quality. The same model can score differently depending on how it is measured.
- Test settings. Artificial Analysis uses temperature 0 for non-reasoning models and 0.6 for reasoning models unless the lab recommends otherwise, and allows reasoning models their maximum disclosed output tokens. A lab's own launch numbers may use different prompts, tools or attempt counts, so the same benchmark name can carry different scores.
- Grading method. Benchmarks mix exact-match answers, unit tests and LLM-judged pairwise comparisons scored as Elo. Elo-based evaluations are anchored to a reference model and normalized, so a change of anchor can shift the numbers.
- Style bias. Arena's style control analysis found that controlling for answer length and markdown headers, bold text and lists noticeably changed rankings, with length the dominant factor. The authors note the analysis is observational and hidden confounders may remain.
- Contamination and selective disclosure. Public test items leaking into training data can inflate scores. The Leaderboard Illusion argues some providers could test many private variants before release and keep the best result, citing 27 private variants Meta tested ahead of Llama 4. The paper also estimates Google and OpenAI received about 19.2% and 20.4% of all Arena data, while 83 open-weight models together received about 29.7%.
To limit memorization, some sites mix in private test sets. On the Artificial Analysis methodology table, the evaluations marked private add up to 45% of the index: AA-Briefcase 15%, AutomationBench-AA 5%, AA-Omniscience 15% and CritPt 10%. Private sets lower leakage risk but make outside auditing harder. Either way, no single number from a single site should settle the question.
A five-step checklist for any AI model comparison chart
- 1
Write down the metric and version
Note whether you are looking at an overall index or a single benchmark, plus the index version and test date. Do not compare charts built on different versions.
- 2
Look for uncertainty
Find confidence intervals, error bars or a rank spread. If two intervals overlap, call it a tie. If none are shown, use the question count and the rough formula above.
- 3
Match the conditions
Do not mix lab-reported numbers with independent results. Compare runs that share reasoning effort, tool access and number of attempts.
- 4
Recalculate cost for your workload
Replace the blended price with your own input-to-output ratio and cache hit rate, and look at cost per task and response time together.
- 5
Test on your own data
Build a small set of real documents, prompts or code tasks and run two or three shortlisted models with identical prompts. Grade the outputs yourself and record failure types; that tells you far more than a rank.
New releases often spread through community chatter before independent scores settle. theddari's AI Telegram trends and blog trends pages show which models and benchmarks people are discussing. Popularity is not evidence of quality, so run any figures you find there through the checklist and the original methodology.

In short, a leaderboard is a map of which models tend to lead, not a verdict on what works best for your task. Treat large gaps as useful signals, treat gaps inside the error margin as ties, and confirm the final choice on your own data. That routine keeps a flashy number-one headline from making the decision for you.
常见问题
Is a 1-2 point gap on an AI benchmark meaningful?
How is the Artificial Analysis Intelligence Index calculated?
Does the number one model on LMArena mean it is the best?
What is benchmark contamination?
Can I pick an API model from a leaderboard alone?
来源与参考资料
- 1Artificial Analysis: Intelligence Benchmarking Methodology(在新标签页中打开)artificialanalysis.ai
- 2Artificial Analysis: Benchmarking Methodology (Definitions)(在新标签页中打开)artificialanalysis.ai
- 3Arena: Arena's Ranking Method(在新标签页中打开)arena.ai
- 4Arena: Does Style Matter? (Style Control)(在新标签页中打开)lmarena.ai
- 5Miller (2024), Adding Error Bars to Evals(在新标签页中打开)arxiv.org
- 6Singh et al. (2025), The Leaderboard Illusion(在新标签页中打开)arxiv.org
相关文章
 AI
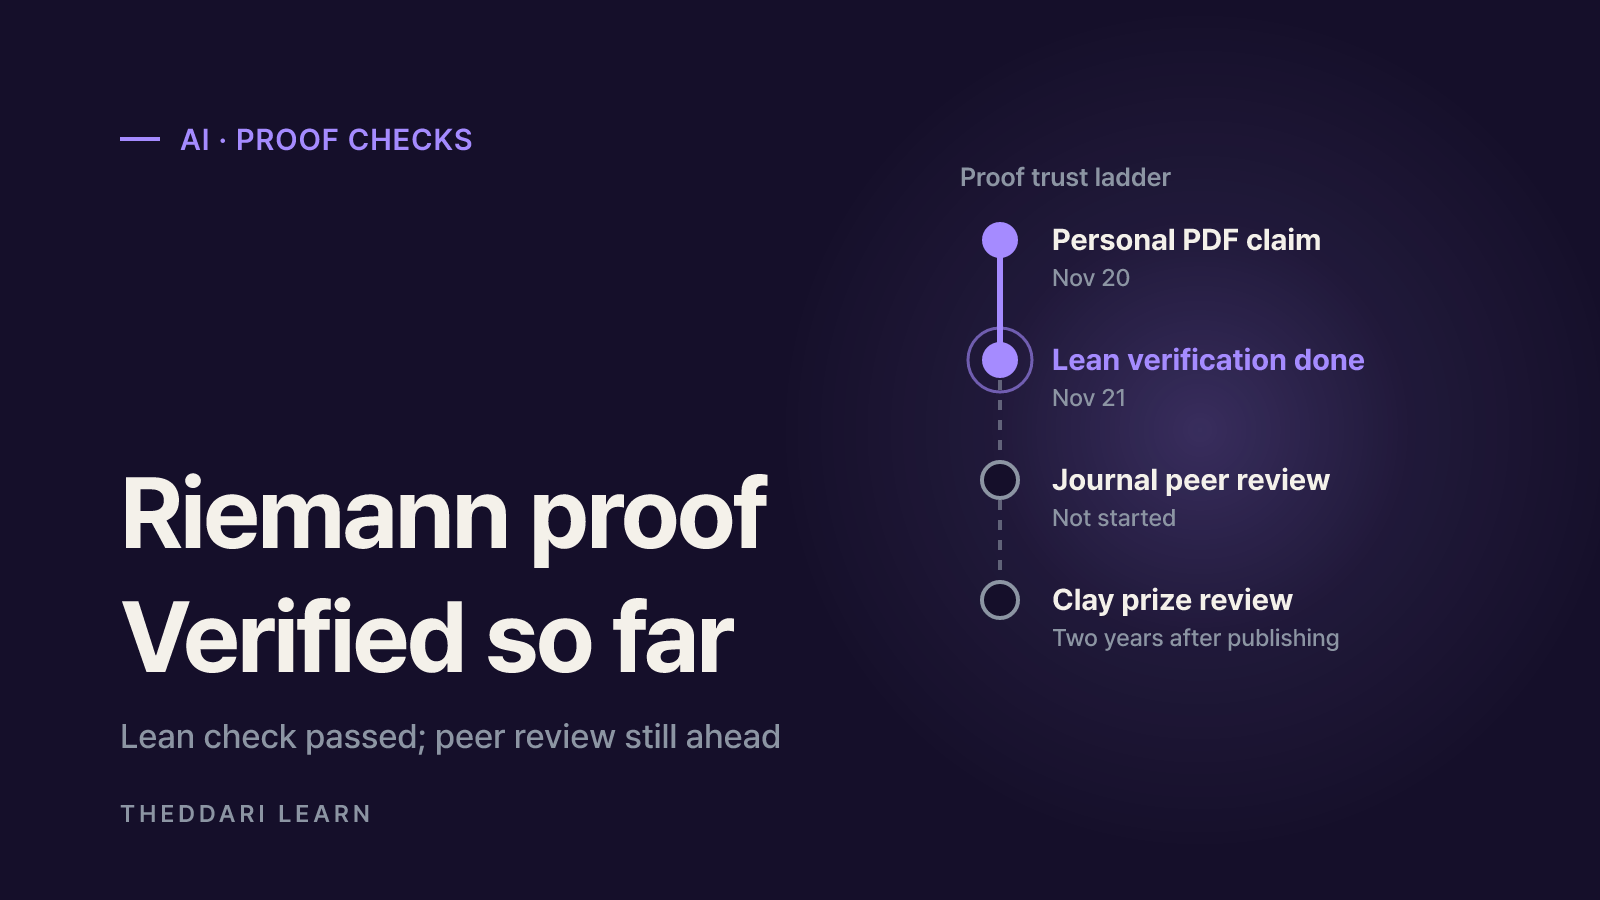
Anthropic's Riemann Hypothesis Proof: Is It Verified?
On November 20, 2026, Anthropic researcher Levent Alpöge said he had proved the Riemann Hypothesis with Claude. A day later the Lean and Mathlib communities certified the formal proof. What that means, what is still missing, and a checklist for judging big proof claims.
 AI
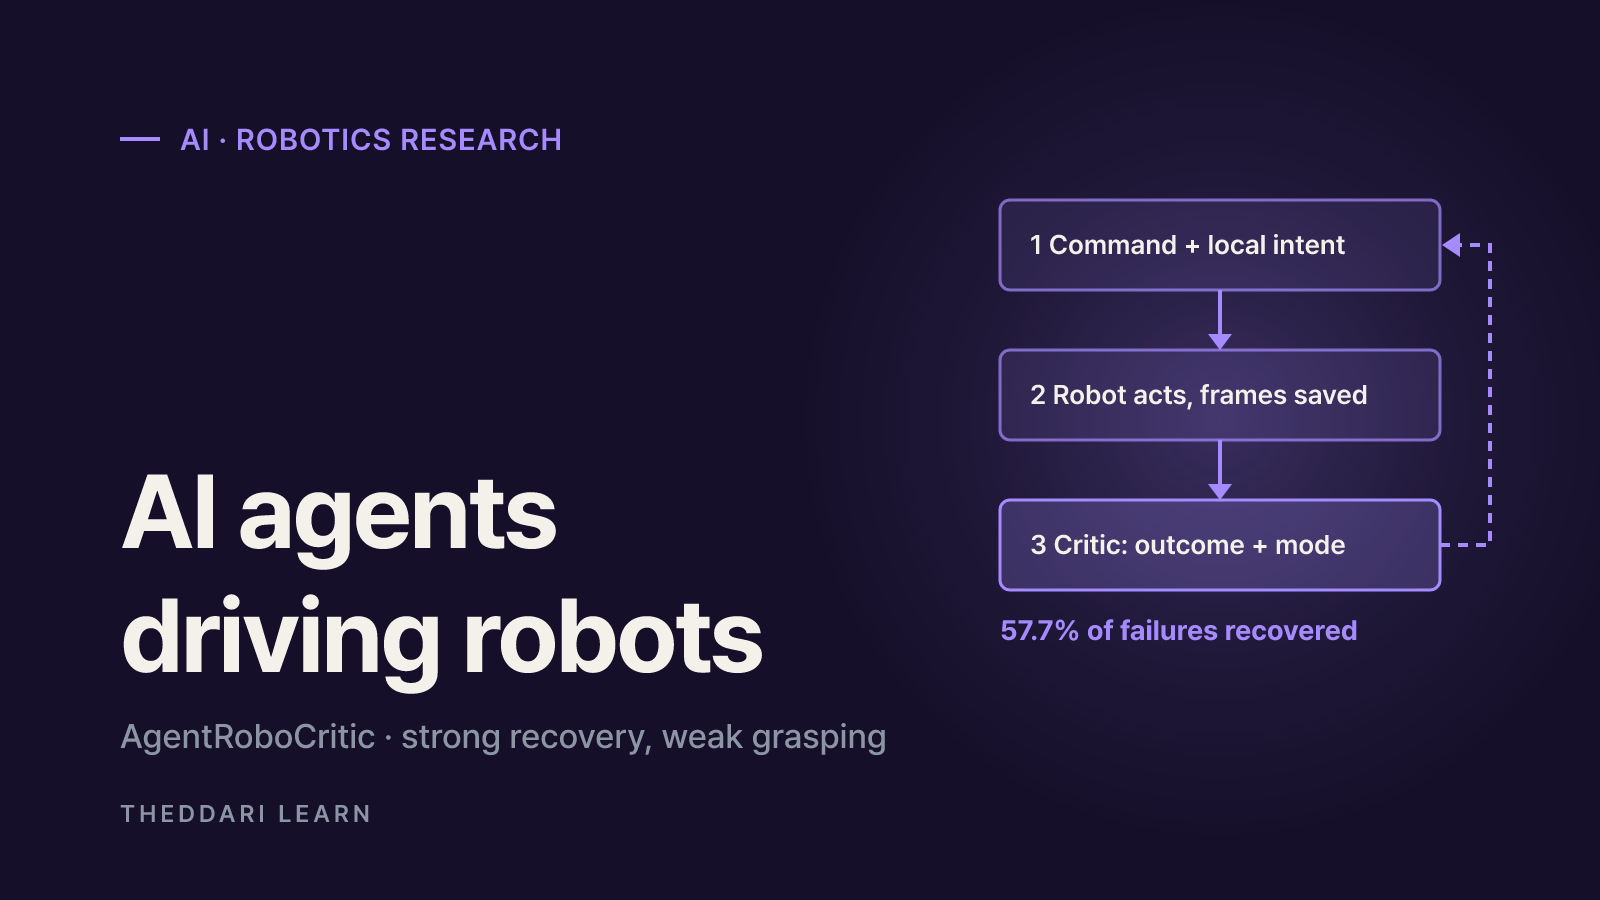
AgentRoboCritic: Can Frontier AI Agents Control Robots?
A November 2026 arXiv study from Carnegie Mellon, UIUC and Bosch scores every action a frontier AI agent sends to a robot. Here is what it found about recovery, grasping, alignment, zero-shot success and latency, and how far to trust it.
 AI
Inkling 2 Mini vs Inkling 2 Small: Specs, Local Use, Limits
Thinking Machines released Inkling 2 Mini on November 20, 2026: a 26.4B-parameter open-weights model with a ~20GB checkpoint that runs on 32GB Macs. Here is how it compares with Inkling 2 Small and what to check before you deploy it.