AI Payoff Outside Tech? What Productivity Data Shows
Apollo says AI shows no payoff outside tech. We check that claim against BLS productivity, corporate profit and Ramp AI spending data as of October 2026.
目录7 个章节
核心要点
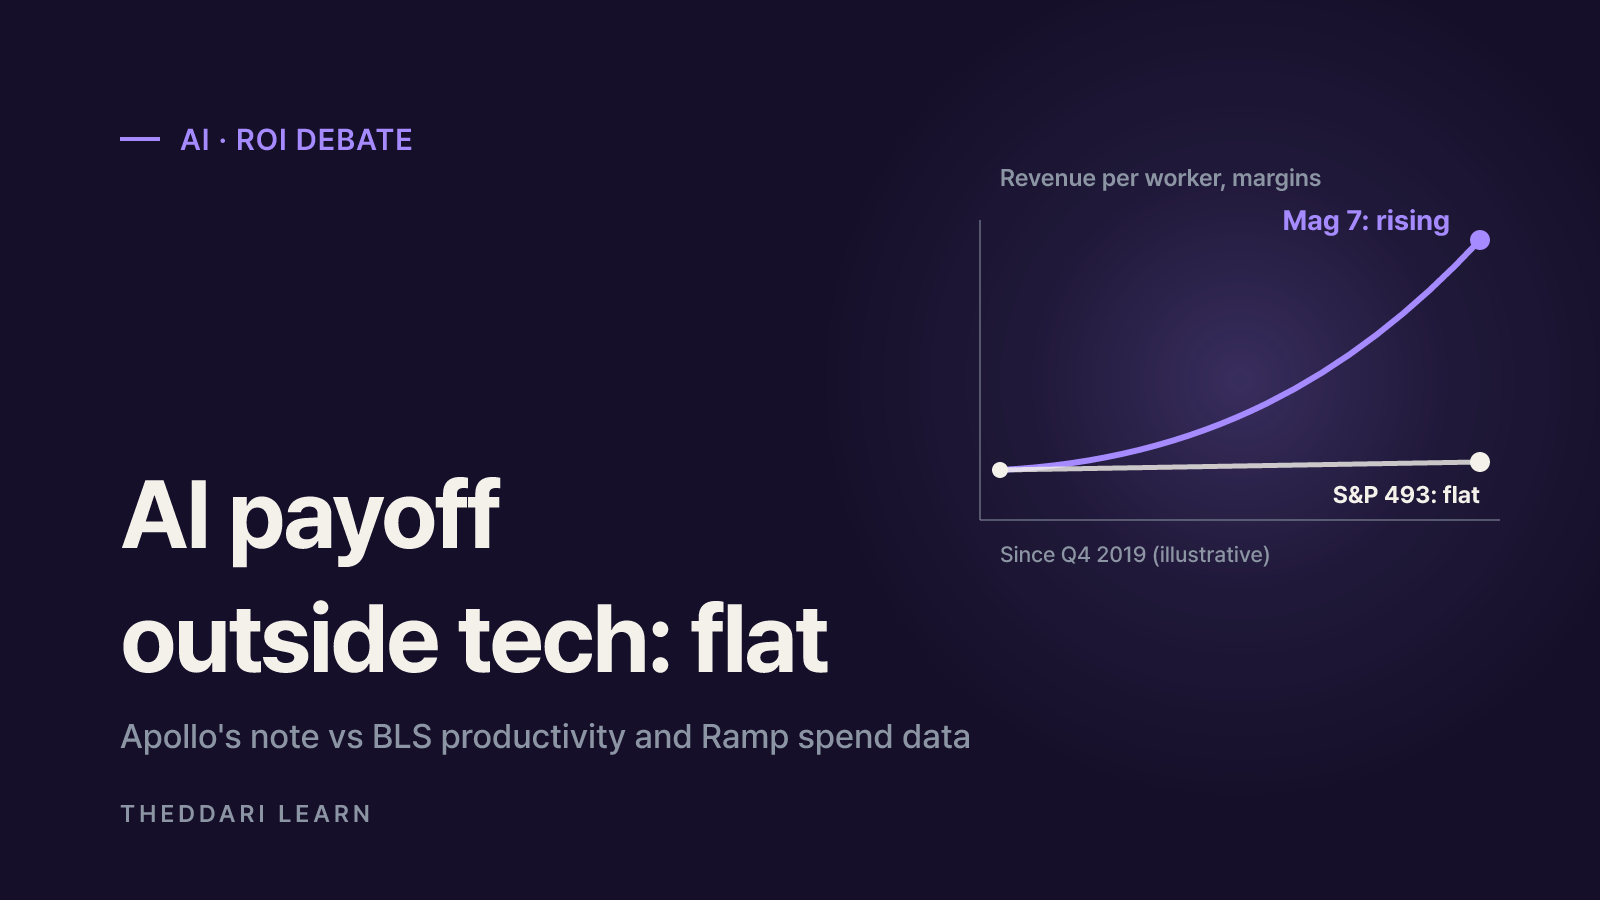
- Apollo's Torsten Slok (Oct 24, 2026) says revenue per worker and margins are rising for the Magnificent 7 but flat for the S&P 493, with no AI boost to productivity.
- BLS data looks stronger: nonfarm labor productivity rose 1.4% annualized in Q2 2026 and 2.1% a year since Q4 2019, but nothing isolates an AI effect.
- On Ramp, 55.9% of US businesses paid for AI in September 2026, yet the median paying firm spent $15.70 per employee a month versus $9,567.53 for the top 1%.
- Adoption, labor productivity and margins measure different things. Whether this is an AI bubble will be settled by S&P 493 earnings and future data, not by one chart.
Is there any AI payoff outside tech yet? As of October 2026, the honest answer is: not clearly in company financials, and while US productivity statistics look healthy, nobody can yet attribute that strength to AI. The debate took off after Apollo chief economist Torsten Slok published No Signs of AI Payoff Outside the Tech Sector on October 24, 2026, arguing that AI has delivered zero financial payoff to corporate America beyond the big tech names. The note hit number one on Hacker News. This guide puts his charts next to official Bureau of Labor Statistics (BLS) data and Ramp's AI spending index so you can see which parts are measured fact and which are interpretation. All figures refer to the United States.
What Apollo actually claims about the AI payoff outside tech
The note is a short Daily Spark built on five charts. Its core move is splitting the market in two: the Magnificent 7 and everyone else in the S&P 500, the so-called S&P 493. Apollo describes the trends in words; the charts do not publish exact values, so this guide does not estimate them.
Revenue per worker (inflation-adjusted to Q4 2019)
- Magnificent 7
- Rising
- S&P 493
- Flat
- Data behind the chart
- Bloomberg, Macrobond
Profit margins
- Magnificent 7
- Rising
- S&P 493
- Flat
- Data behind the chart
- Bloomberg, Macrobond
Total factor productivity growth
- Magnificent 7
- Economy-wide: no sign of an AI boost
- S&P 493
- —
- Data behind the chart
- San Francisco Fed utilization-adjusted series, BLS
Distribution of AI spending
- Magnificent 7
- Extremely concentrated in a few firms
- S&P 493
- —
- Data behind the chart
- Ramp
Slok's argument runs like this. Venture-backed startups keep spending more on tokens, the metered units you pay for when calling an AI model. Mainstream companies, he says, do not need the latest model and will not pay up for it. With no visible effect on the bottom line, many are starting to treat token spending as a cost center that weighs on margins rather than a growth engine. His conclusion: the AI story will be decided in the S&P 493, not the Mag 7.
Caveats worth keeping in mind
- It is a macro observation comparing group averages, not a study linking each firm's AI use to its results.
- Words like flat are readings of a chart. The Q4 2019 base period and the inflation adjustment both shape how the lines look.
- The claim that AI cannot grasp judgment, trust, culture or accountability is the author's opinion, not a data point.
- Apollo's own disclosures say the views reflect judgment at the time and may change. It is a narrow basis for any portfolio decision.
The other side: official AI productivity data and profits
Government statistics paint a sunnier picture. According to the BLS Productivity and Costs release for Q2 2026, revised on September 3, 2026, nonfarm business labor productivity grew at a 1.4% annual rate in the second quarter and 2.2% from a year earlier. Since the current business cycle began in Q4 2019, productivity has grown 2.1% a year, faster than the 1.5% pace of the 2007 to 2019 cycle and equal to the long-run average since 1947.
Nonfarm labor productivity, Q2 2026
- Value
- +1.4% annualized, +2.2% year over year
- Read it with care
- Q1 2026 was only +0.8% annualized
Average productivity growth since Q4 2019
- Value
- +2.1% a year
- Read it with care
- Beats the prior cycle's 1.5%, matches the long-run norm
Nonfinancial corporate unit profits, Q2 2026
- Value
- +43.0% annualized, +17.8% over four quarters
- Read it with care
- Fastest since 2021, but includes tech companies
Labor share, Q2 2026
- Value
- 52.8%
- Read it with care
- Lowest since the series began in 1947
Manufacturing labor productivity, Q2 2026
- Value
- +2.4% annualized
- Read it with care
- Output is measured differently from the nonfarm series
So productivity is up and profits are up. Why does Apollo still see no payoff? The answer lies in what each number measures.
Labor productivity is not total factor productivity
BLS notes that labor productivity reflects technology, capital investment, capacity utilization, how production is organized, managerial skill and workforce characteristics all at once. When companies pour money into servers and data centers, each worker has more capital to work with and output per hour can rise. Total factor productivity tries to measure the leftover efficiency that inputs cannot explain. Apollo's point is closer to this: spending more may lift output, but the economy is not yet getting more from the same inputs.
Profit totals hide the sector split
The jump in nonfinancial corporate unit profits is striking, but the BLS aggregate includes the same tech giants Apollo set aside. A record-low labor share also leaves room for profits to have come from pricing and cost shifts rather than efficiency. Sector-level earnings are the only way to settle that.
Adoption is 55.9%, so why is AI spending so concentrated?
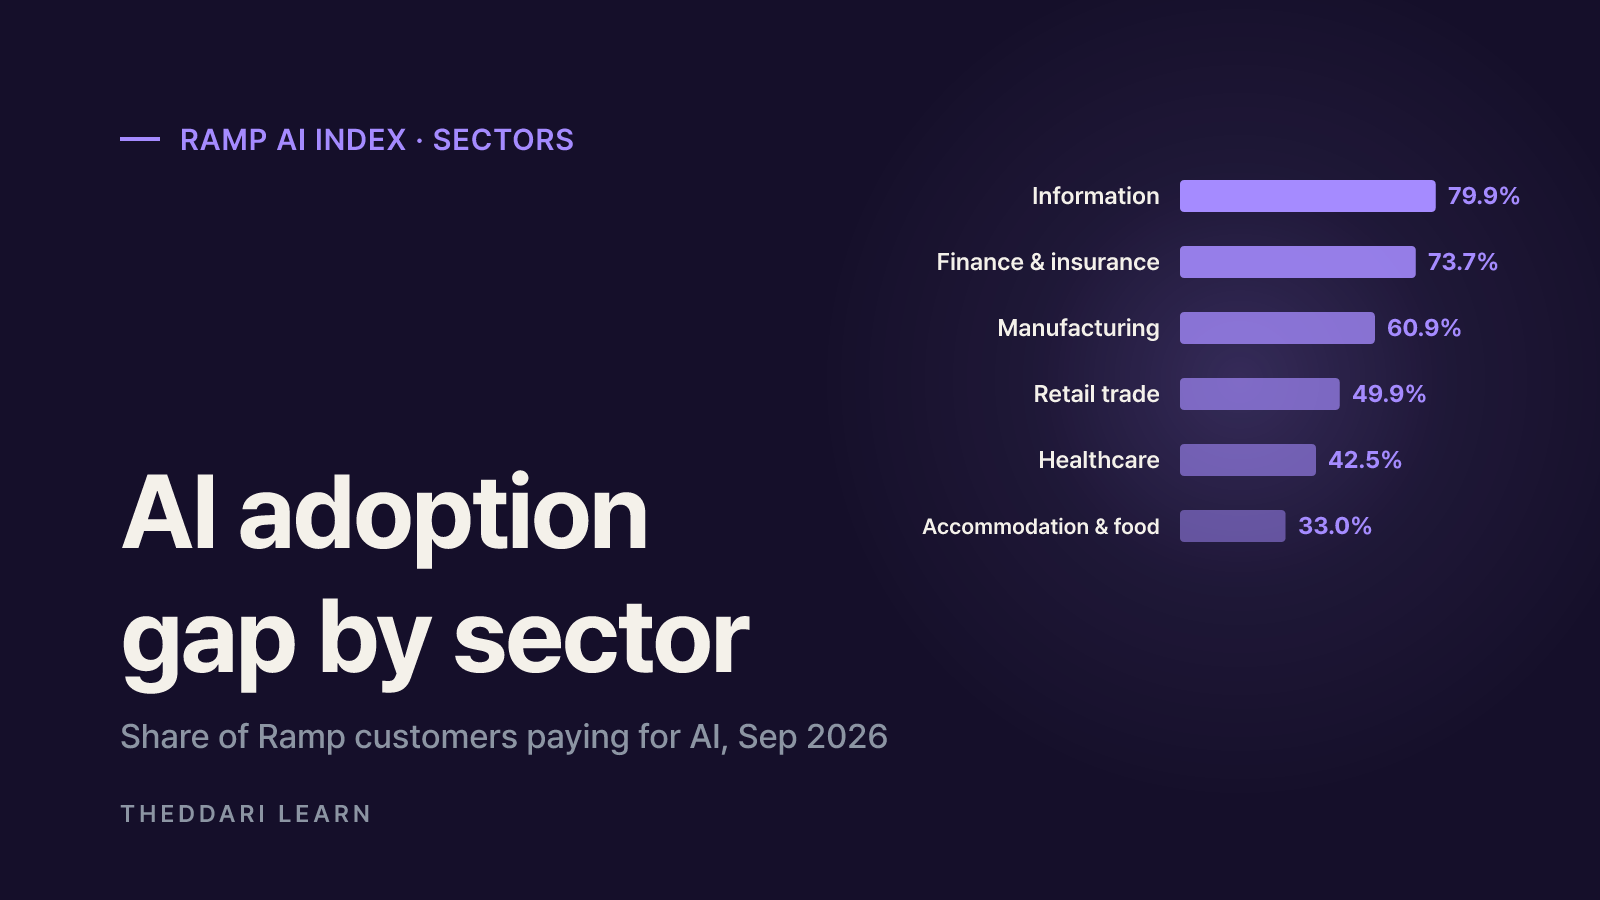
Ramp, a corporate card and bill-pay company, publishes the monthly Ramp AI Index from the actual transactions of more than 85,000 US businesses. In September 2026, 55.9% of them paid for AI models, subscriptions, tokens or APIs, up 12.1 percentage points from a year earlier. The gap between industries is wide.
| Sector (Ramp customers) | Paid AI adoption, Sep 2026 |
|---|---|
| Information | 79.9% |
| Finance and insurance | 73.7% |
| Manufacturing | 60.9% |
| Retail trade | 49.9% |
| Construction | 43.2% |
| Healthcare | 42.5% |
| Accommodation and food | 33.0% |
Intensity tells a sharper story. Among firms paying for AI, the median spent $15.70 per employee per month, the top 10% spent $813.43, and the top 1% spent $9,567.53. In his October 2026 letter, Ramp lead economist Ara Kharazian recalled that 80% of spend on OpenAI and Anthropic comes from 1% of firms, and said new-customer growth has slowed so much that adoption looks like it is near the top of the S-curve.
Flat token spend, falling prices
The same letter recorded two straight months, August and September, of virtually no growth in token spend even as token volumes rose. Kharazian's main explanation is falling prices at the frontier plus efficiency gains. On Ramp's index, the blended price per million tokens across OpenAI and Anthropic was $0.64 in the week ending October 11, down 25.4% from $0.86 a month earlier. AI spend did hit a new peak in early October, 1.5% above August, but growth has clearly slowed.
This fits Apollo's thesis: most companies use a little AI, and a small group uses a lot. While heavy use stays concentrated, it is hard for AI to move economy-wide productivity or profit totals. The flip side is that cheaper intelligence lowers the cost of trying, which is exactly the open question Apollo ends on: can mainstream firms turn increasingly cheap AI into faster revenue growth and higher margins?
What the AI ROI debate data cannot tell you
- Time lags: Economists have long argued that general-purpose technologies such as electricity and computers showed up in productivity only after firms reorganized around them. No payoff yet is a different claim from no payoff ever.
- Causation: Neither Apollo's group averages nor BLS aggregates show that firms using AI did better. Interest rates, tariffs and the business cycle move at the same time.
- Sample: Ramp data covers its own customers and cannot be assumed to represent every US company. Ramp itself says free tools and personal accounts are invisible, so it likely undercounts adoption.
- Revisions: BLS says the third estimate of quarterly nonfarm productivity has differed from the first by -1.1 to +1.4 percentage points about 80% of the time. Do not build a trend on one or two quarters.
- Definitions: Tech sector and Mag 7 are not the same thing. Apollo's split leaves out smaller listed tech firms and private companies entirely.
A single economist's chart pack or a viral forum post tells you about sentiment. Judging any AI-exposed stock still requires company-level work on revenue mix, payback periods for capital spending and balance-sheet risk.
How to track the AI payoff yourself
- 1
Mark the next productivity release
BLS plans to publish preliminary Q3 2026 productivity and costs on November 5, 2026 at 8:30 a.m. Eastern Time. The theddari economic calendar lists major US data releases in one place.
- 2
Read S&P 493 margins, not headlines
In quarterly results from large non-tech companies, compare revenue growth, operating margin, labor costs and any quantified AI savings or revenue. Find reporting dates in the earnings calendar. Vague claims about AI efficiency without numbers are a weak signal.
- 3
Watch spending intensity
Ramp updates adoption, spend per employee and token prices monthly. A rising median spend per employee says more about broad diffusion than the headline adoption rate.
- 4
Follow how the narrative moves
The AI ROI debate swings with big tech earnings and data center news. Use the theddari AI Telegram trends page to see which stories keep resurfacing, then go back to the primary data.

Bottom line: as of October 2026, the AI payoff is visible in tech company results and among a small set of heavy users, but not yet in the revenue, margins or total factor productivity of the broader S&P 493. At the same time, solid US productivity and profit numbers give no basis for declaring AI a failure. The answer depends on whether ordinary companies convert ever-cheaper AI into real margin gains, and the evidence will arrive one earnings season and one BLS release at a time.
常见问题
What does S&P 493 mean?
If US productivity is rising, isn't AI already paying off?
Why are adoption rates high if the payoff is invisible?
Does Apollo's note mean the AI bubble is about to burst?
来源与参考资料
- 1Apollo, No Signs of AI Payoff Outside the Tech Sector (Oct 24, 2026)(在新标签页中打开)www.apollo.com
- 2U.S. Bureau of Labor Statistics, Productivity and Costs, Second Quarter 2026, Revised(在新标签页中打开)www.bls.gov
- 3Ramp AI Index (data through September 2026)(在新标签页中打开)ramp.com
- 4Ramp, October 2026 Ramp AI Index: Cracks in the AI thesis, part 3(在新标签页中打开)ramp.com
相关文章
 AI
Anthropic's Riemann Hypothesis Proof: Is It Verified?
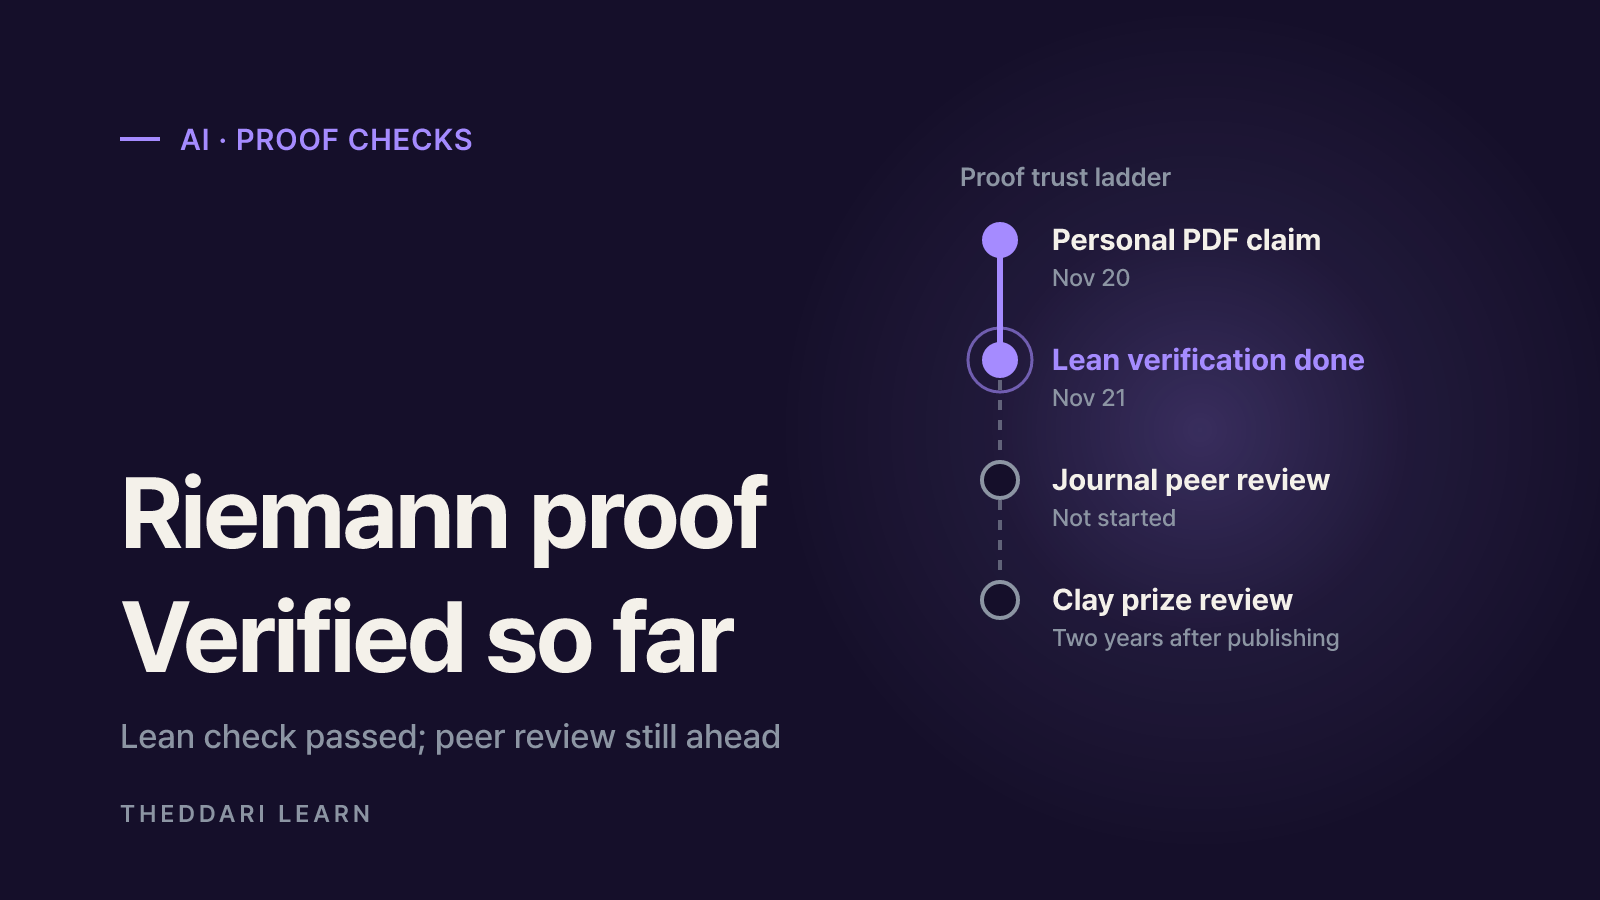
On November 20, 2026, Anthropic researcher Levent Alpöge said he had proved the Riemann Hypothesis with Claude. A day later the Lean and Mathlib communities certified the formal proof. What that means, what is still missing, and a checklist for judging big proof claims.
 AI
AgentRoboCritic: Can Frontier AI Agents Control Robots?
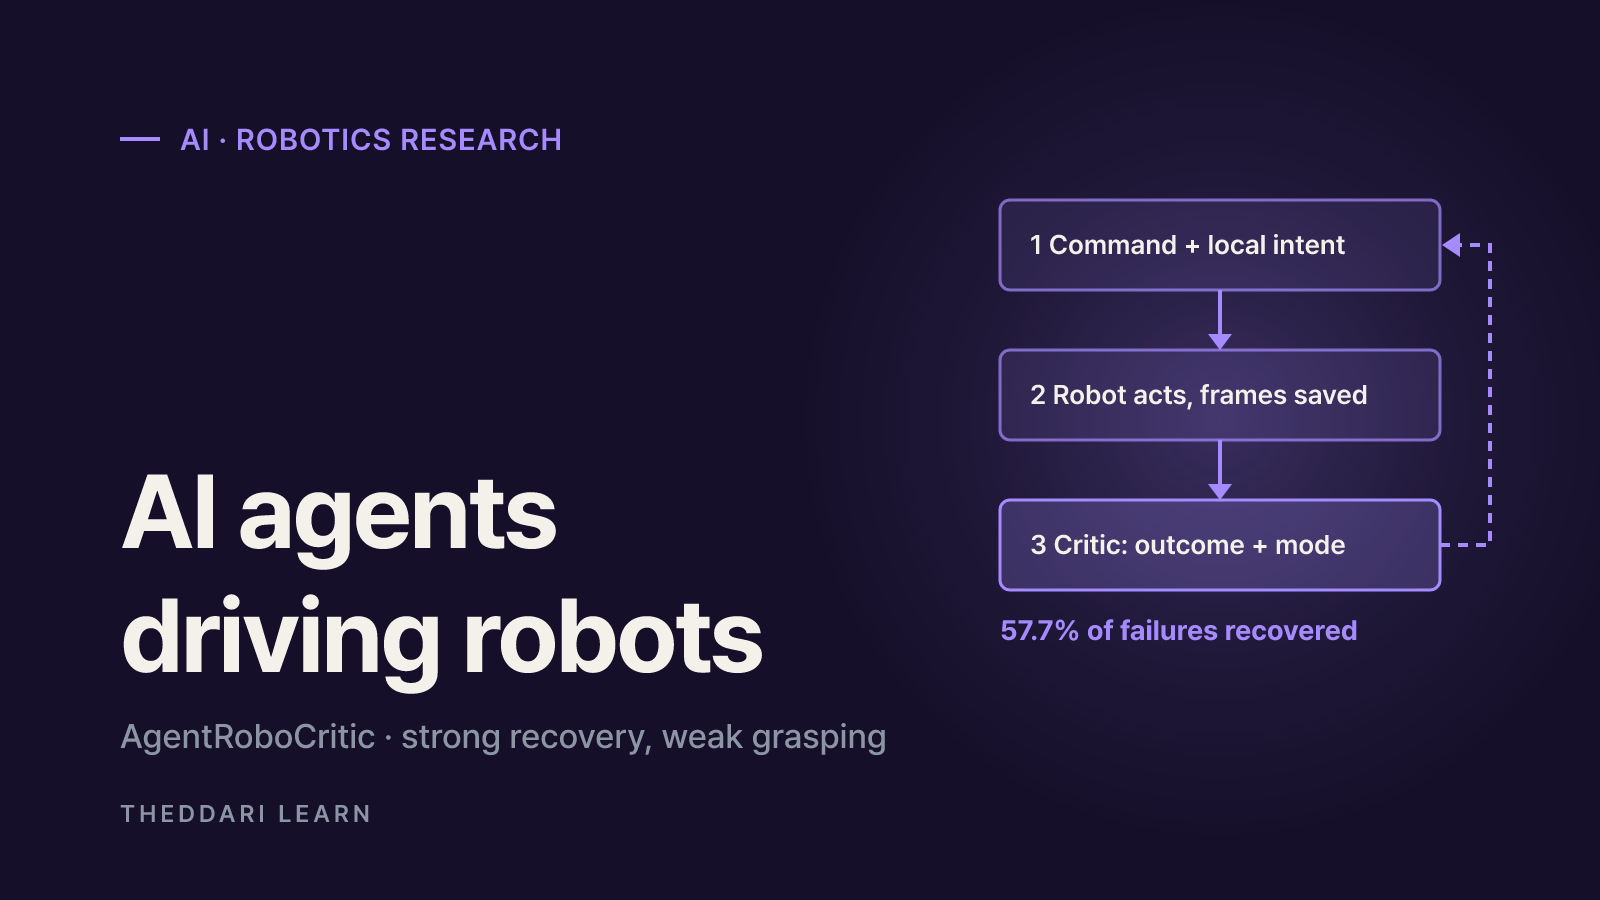
A November 2026 arXiv study from Carnegie Mellon, UIUC and Bosch scores every action a frontier AI agent sends to a robot. Here is what it found about recovery, grasping, alignment, zero-shot success and latency, and how far to trust it.
 AI
Inkling 2 Mini vs Inkling 2 Small: Specs, Local Use, Limits
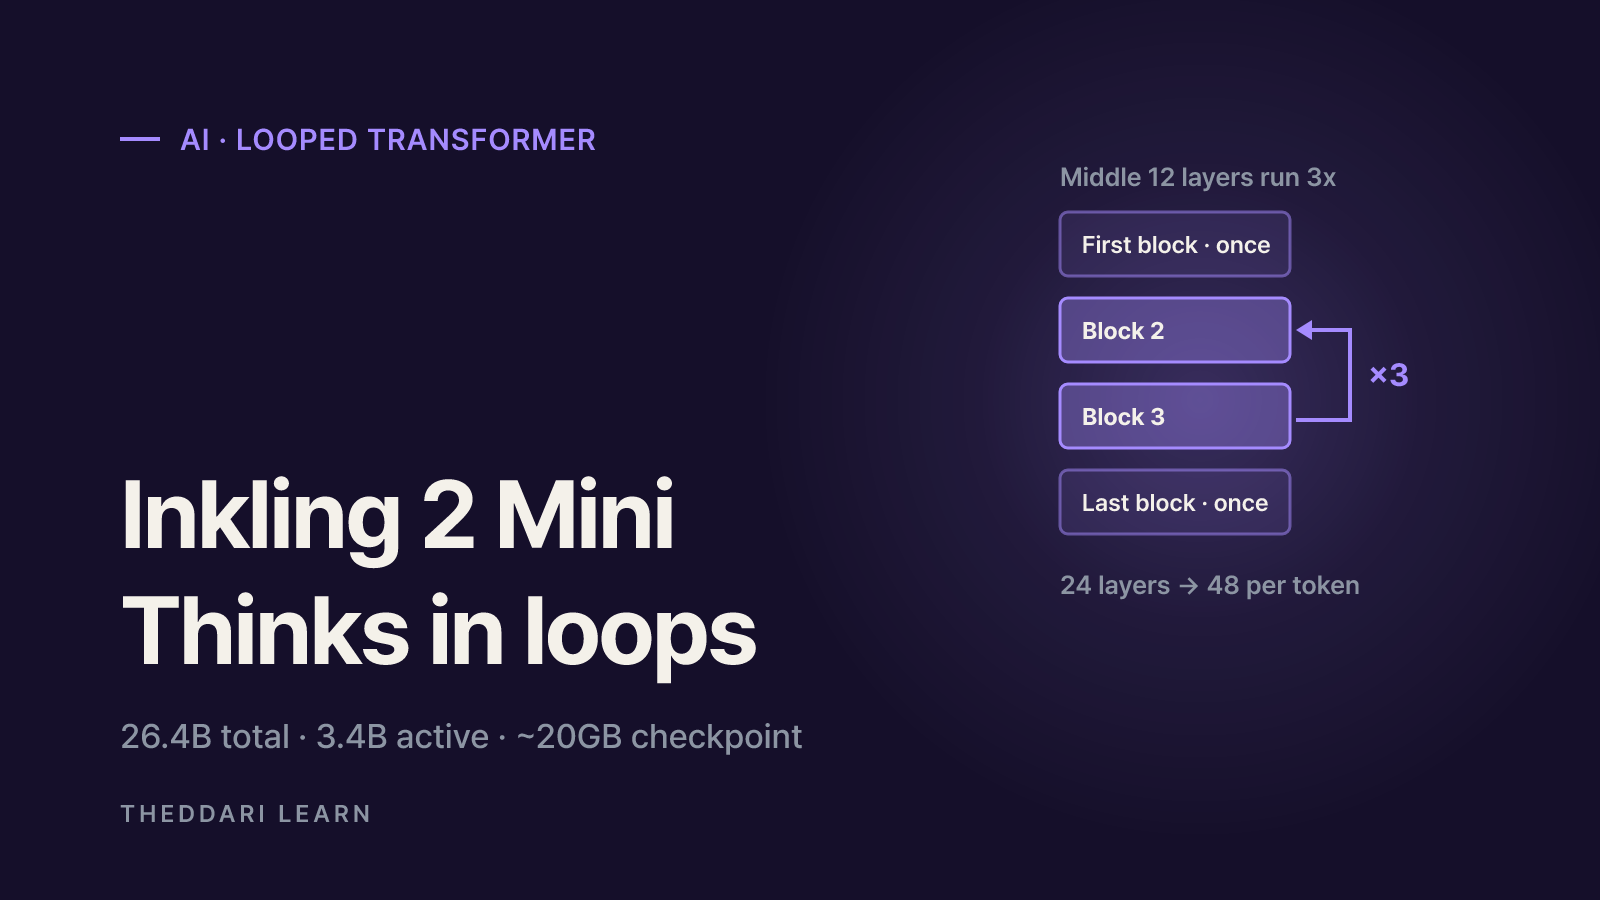
Thinking Machines released Inkling 2 Mini on November 20, 2026: a 26.4B-parameter open-weights model with a ~20GB checkpoint that runs on 32GB Macs. Here is how it compares with Inkling 2 Small and what to check before you deploy it.