目录7 个章节
Realty Income (NYSE: O) and VICI Properties (NYSE: VICI) are both S&P 500 REITs that many income investors look up side by side, but they earn and distribute cash in very different ways. Realty Income leases more than 15,500 single-tenant commercial properties to a long list of businesses and pays a monthly dividend. VICI owns casino resorts and other experiential real estate, leases them to a small group of large operators under decades-long master leases, and pays a quarterly dividend. This comparison uses the companies' own filings and releases published through October 2026. It explains the dividend math, lease structures and interest-rate exposure so you can read each company's next report with the right questions, rather than ranking one stock above the other.
Realty Income vs VICI at a glance
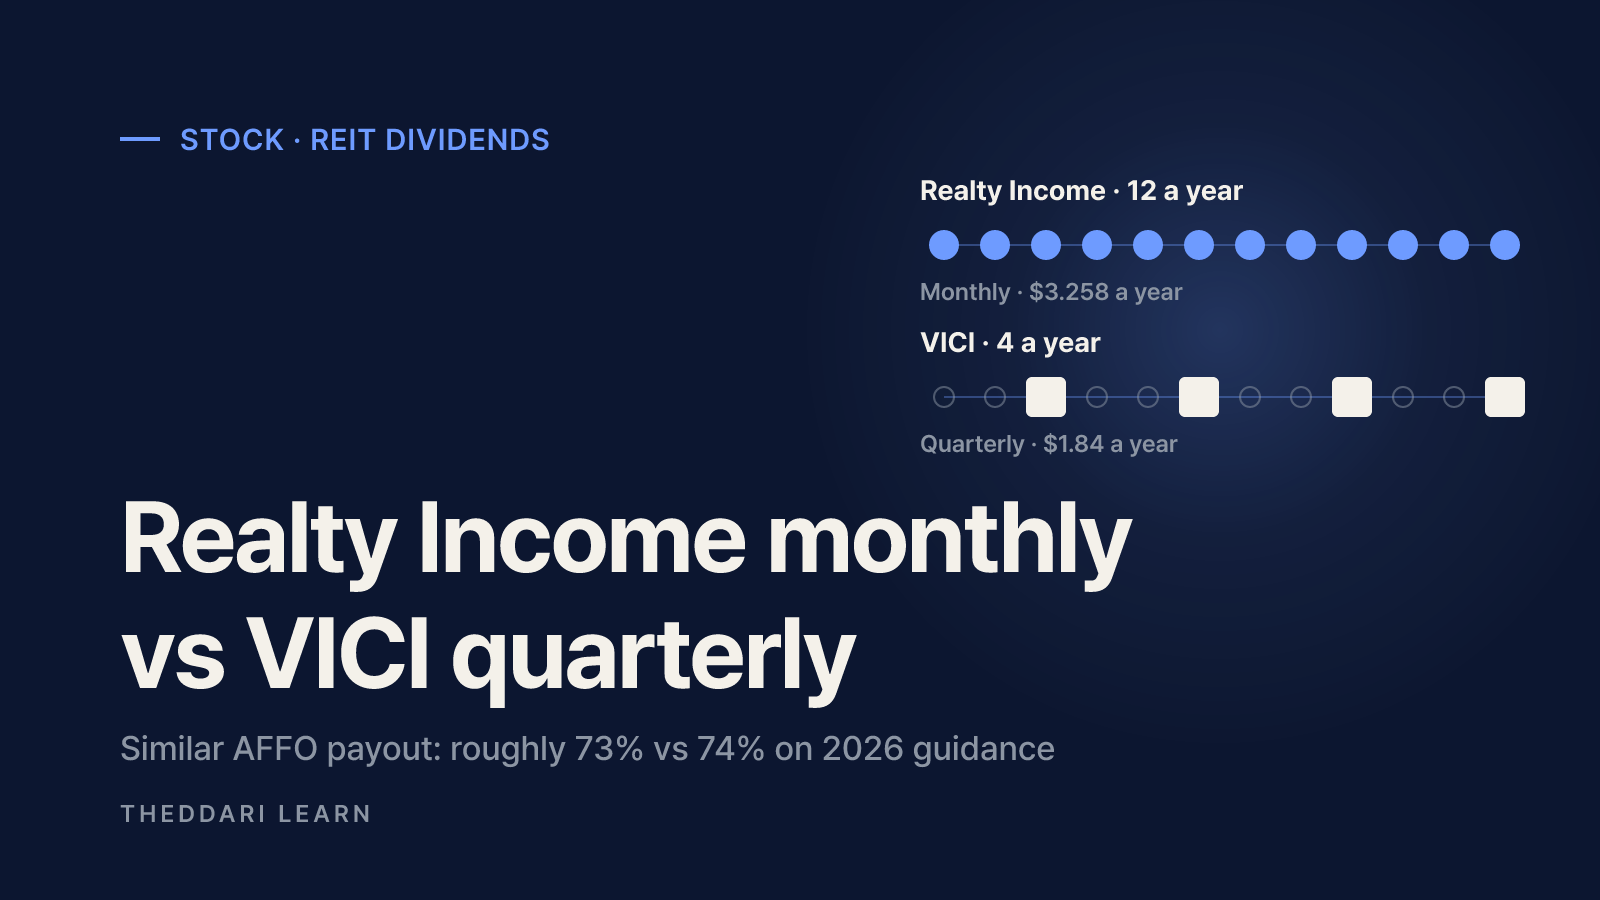
On September 8, 2026, Realty Income raised its monthly dividend from $0.2710 to $0.2715 per share, an annualized $3.258. The company called it the 136th increase since its 1994 NYSE listing and said it has declared 675 consecutive monthly dividends since its founding. In its third-quarter 2026 results, VICI reported a quarterly dividend of $0.46 per share ($1.84 annualized, up 2.2% year over year) and described it as its ninth consecutive annual increase since its IPO.
Payment frequency
- Realty Income (O)
- Monthly (12 per year)
- VICI Properties (VICI)
- Quarterly (4 per year)
Latest dividend
- Realty Income (O)
- $0.2715 per month (paid Oct 15, 2026)
- VICI Properties (VICI)
- $0.46 per quarter (paid Oct 8, 2026)
Annualized dividend
- Realty Income (O)
- $3.258 per share
- VICI Properties (VICI)
- $1.84 per share
2026 AFFO guidance
- Realty Income (O)
- $4.44–$4.45 per share (Aug 2026)
- VICI Properties (VICI)
- $2.47–$2.48 per share (Oct 2026)
Portfolio
- Realty Income (O)
- 15,588 properties, 1,798 clients, 92 industries (June 30, 2026)
- VICI Properties (VICI)
- 103 experiential assets: 63 gaming, 40 other (US and Canada)
Typical lease
- Realty Income (O)
- Long-term net lease, ~8.6-year weighted average remaining term
- VICI Properties (VICI)
- Long-term triple-net master lease
Key risks
- Realty Income (O)
- Tenant retail health, FX from European growth, funding costs
- VICI Properties (VICI)
- Operator and Las Vegas concentration, gaming regulation, refinancing
The table shows that the real difference is not the payment calendar. Realty Income's diversification means any single tenant failure is small, but broad retail and industrial trends flow through the whole portfolio. VICI's cash flow is highly predictable because the leases are so long, yet a problem at a core operator such as Caesars or MGM would matter far more.
REIT dividends: 12 payments vs 4, and AFFO coverage
US REITs must distribute at least 90% of their taxable income to keep REIT status; VICI's own risk factors note that this requirement can limit its growth strategy. That is why REIT dividends behave more like a pass-through of rental cash flow than a discretionary payout. To judge coverage, investors look past net income to FFO (funds from operations) and AFFO (adjusted FFO), because real estate depreciation is a large non-cash expense. Realty Income reported Q2 2026 AFFO of $1.09 per share and raised full-year 2026 guidance to $4.44–$4.45. VICI reported Q3 AFFO of $0.62 per share and raised 2026 guidance to $2.47–$2.48.
A simple AFFO payout ratio
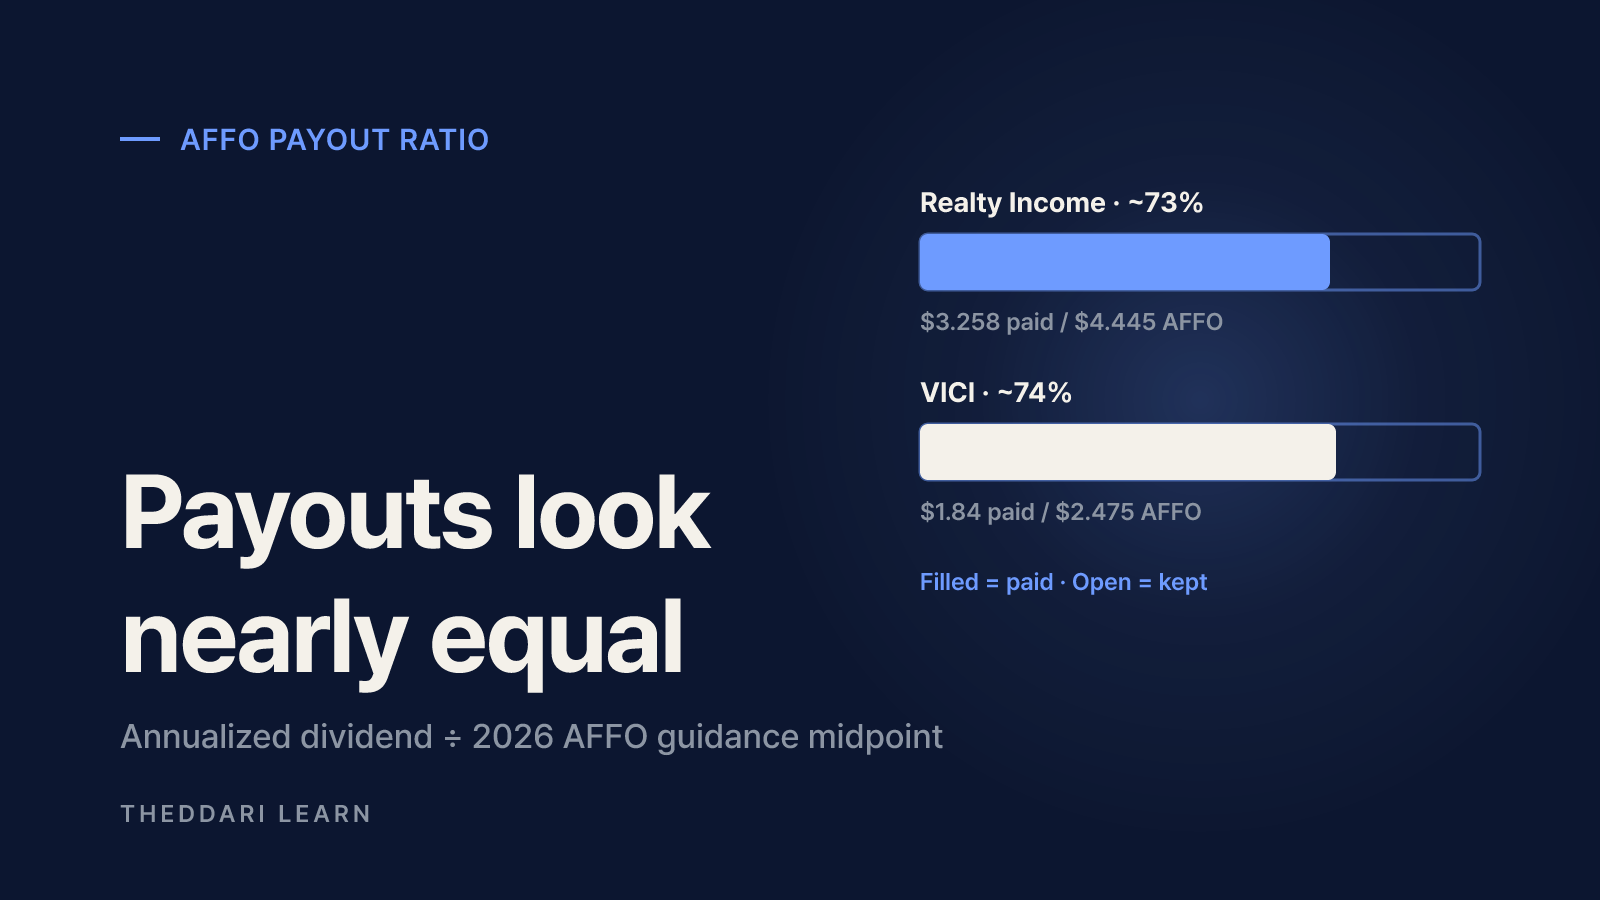
Divide the annualized dividend by the guidance midpoint. Realty Income: $3.258 ÷ $4.445 ≈ 73%. VICI: $1.84 ÷ $2.475 ≈ 74%. Both retain roughly a quarter of AFFO for reinvestment and debt management. These ratios are our arithmetic from the disclosed figures, not company-reported metrics, and they will move whenever guidance or the dividend changes.
Why VICI's FFO can mislead
Most of VICI's casino real estate is accounted for as sales-type leases or lease financing receivables, so it records almost no real estate depreciation. FFO therefore equals net income, and changes in the CECL credit loss allowance hit it directly. In Q3 2026, FFO fell to $0.31 per share from $0.71, while AFFO rose 4.3% to $0.62. Using FFO alone would make VICI's dividend look uncovered; using AFFO alone would ignore a growing reserve. Read both, plus the company's explanation.
Lease structure: diversified net lease vs casino master lease
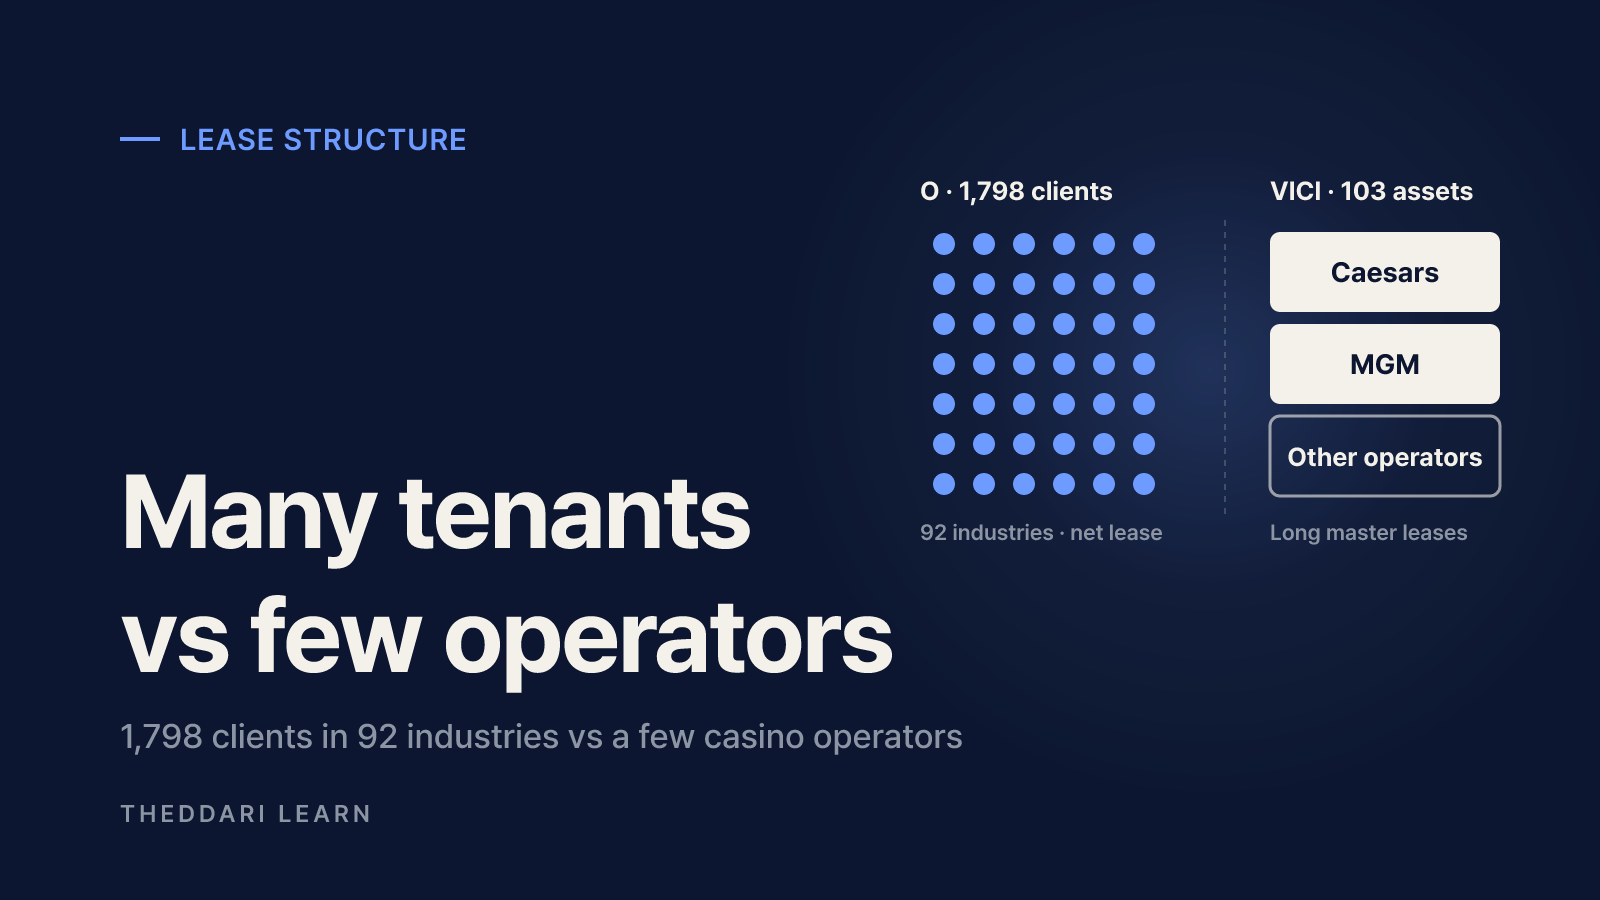
As of June 30, 2026, Realty Income leased 15,588 properties to 1,798 clients in 92 industries, with a weighted average remaining lease term of about 8.6 years and occupancy of 98.8%. Under a net lease, the tenant covers most property taxes, insurance and maintenance, which keeps the landlord's cost base stable. Re-leased properties in the quarter achieved 102.7% of prior rent. Assets span all 50 US states, the UK and eight other European countries, so euro and sterling movements affect reported results.
VICI's model rests on long triple-net master leases with a few large operators. Its portfolio includes Caesars Palace Las Vegas, MGM Grand and The Venetian Resort, among 103 experiential assets. A master lease bundles many properties into one contract, which makes it hard for an operator to walk away from a weak site while keeping the strong ones. VICI's Q3 revenue breakdown shows Caesars- and MGM-related leases as the largest contractual rent lines.
An example of VICI's escalator terms
The Highfield master lease VICI announced in September 2026 illustrates the template: a 20-year initial term with four 5-year renewal options, annual escalation equal to the greater of 1.25% and Canadian CPI, capped at 2.50%, and minimum capital expenditure of 1.0% of each property's annual net revenue. Caps like this mean rent may lag if inflation runs above the ceiling. Terms vary by lease, so the 10-Q lease summary is the place to verify term, escalator and renewal details.
How interest rates and debt affect REIT dividends
REITs refinance and raise debt continually, so higher rates raise their cost of capital. In August 2026 VICI issued $1.75 billion of senior notes at a weighted average 5.570% (5.422% after hedges) to redeem 2026 maturities carrying 4.25%–4.50% coupons. Total debt was about $17.2 billion at September 30, 2026. The same rent with higher interest expense slows AFFO growth. Realty Income issued €600 million of 3.625% notes in July 2026 and received an 'A' rating from Fitch in August 2026.
Rates also move share prices. When Treasury yields rise, REIT shares often weaken, which pushes up the dividend yield without any change in the payout. Always check whether a higher yield reflects a dividend increase or a falling price. You can track Fed meetings and inflation releases on the theddari economic calendar and the next O and VICI report dates on the earnings calendar; confirm dates with the companies and treat the calendar as a schedule, not a forecast.

Checklist before comparing these REIT dividends
- Separate the annual dividend from the payment rhythm: note the annualized rate, recent increases, record dates and pay dates.
- Recalculate AFFO coverage each quarter using updated guidance; for VICI, read the CECL allowance discussion.
- For Realty Income, watch occupancy, re-leasing spreads and top-tenant exposure; for VICI, watch Caesars and MGM credit, escalator caps and lease maturities.
- Check withholding on your brokerage statement and your home-country tax treatment, since US REIT dividends paid abroad are usually taxed at source.
- Remember that both dividends are declared by each board; past increase streaks describe history, not future payments.
In short, Realty Income is a monthly dividend REIT that collects small amounts from many tenants, while VICI is a quarterly payer that collects large, long-dated rent from a few casino operators. Their 2026 payout ratios look similar, but the risks sit in different places: funding costs and broad tenant health for O, operator concentration and lease terms for VICI.